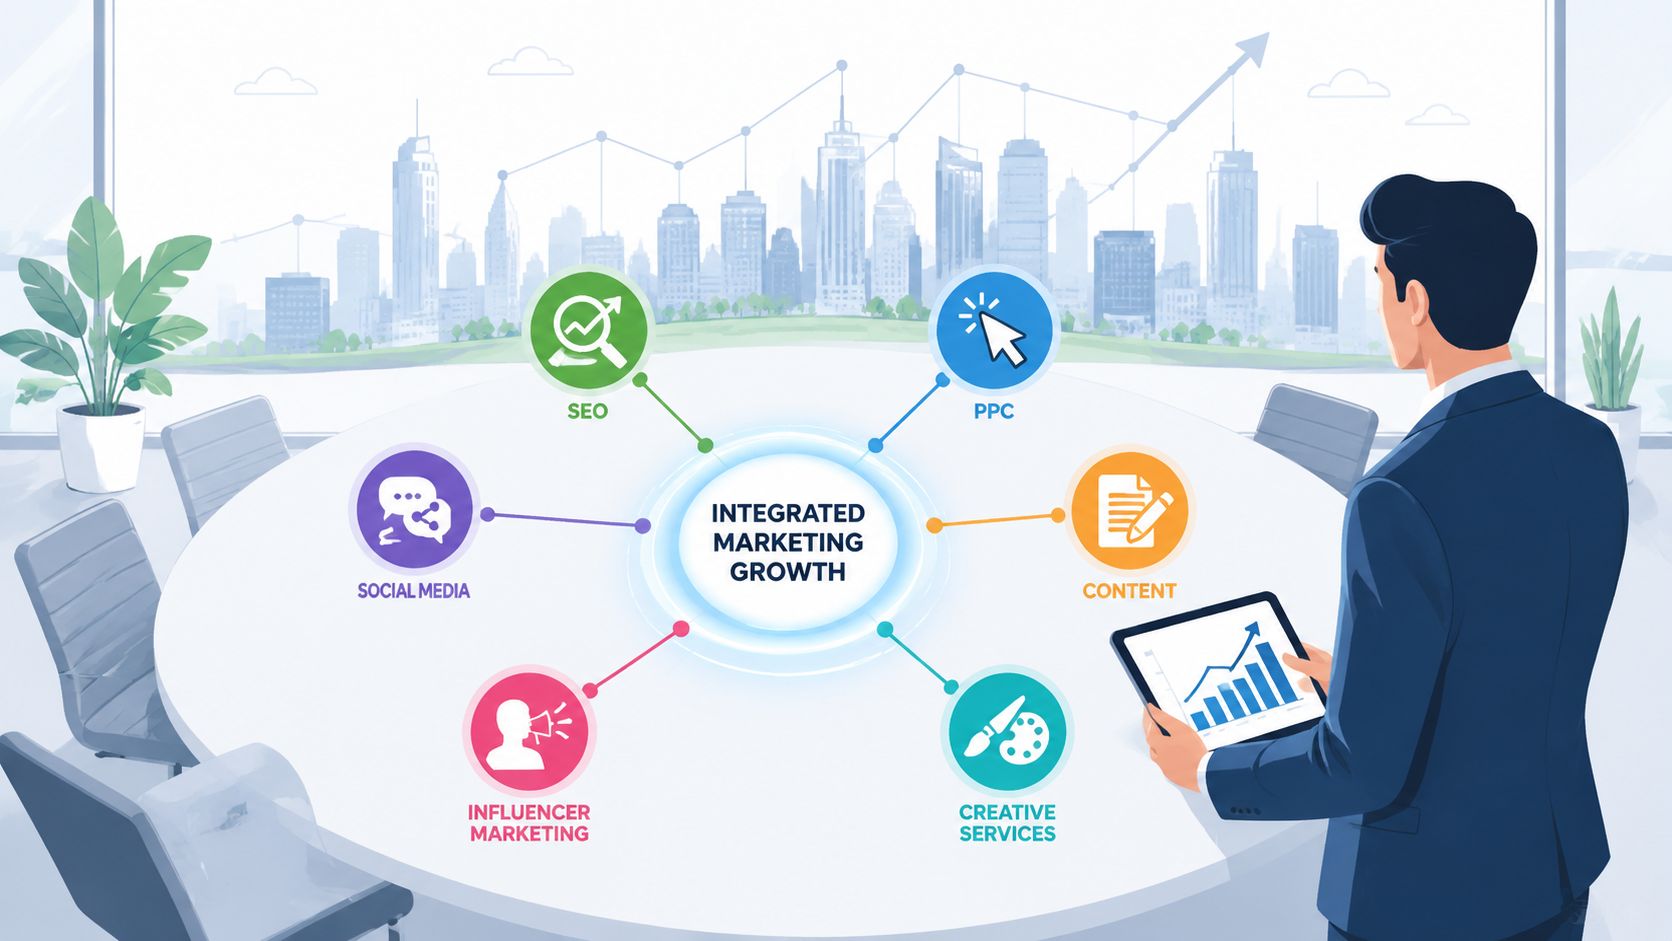
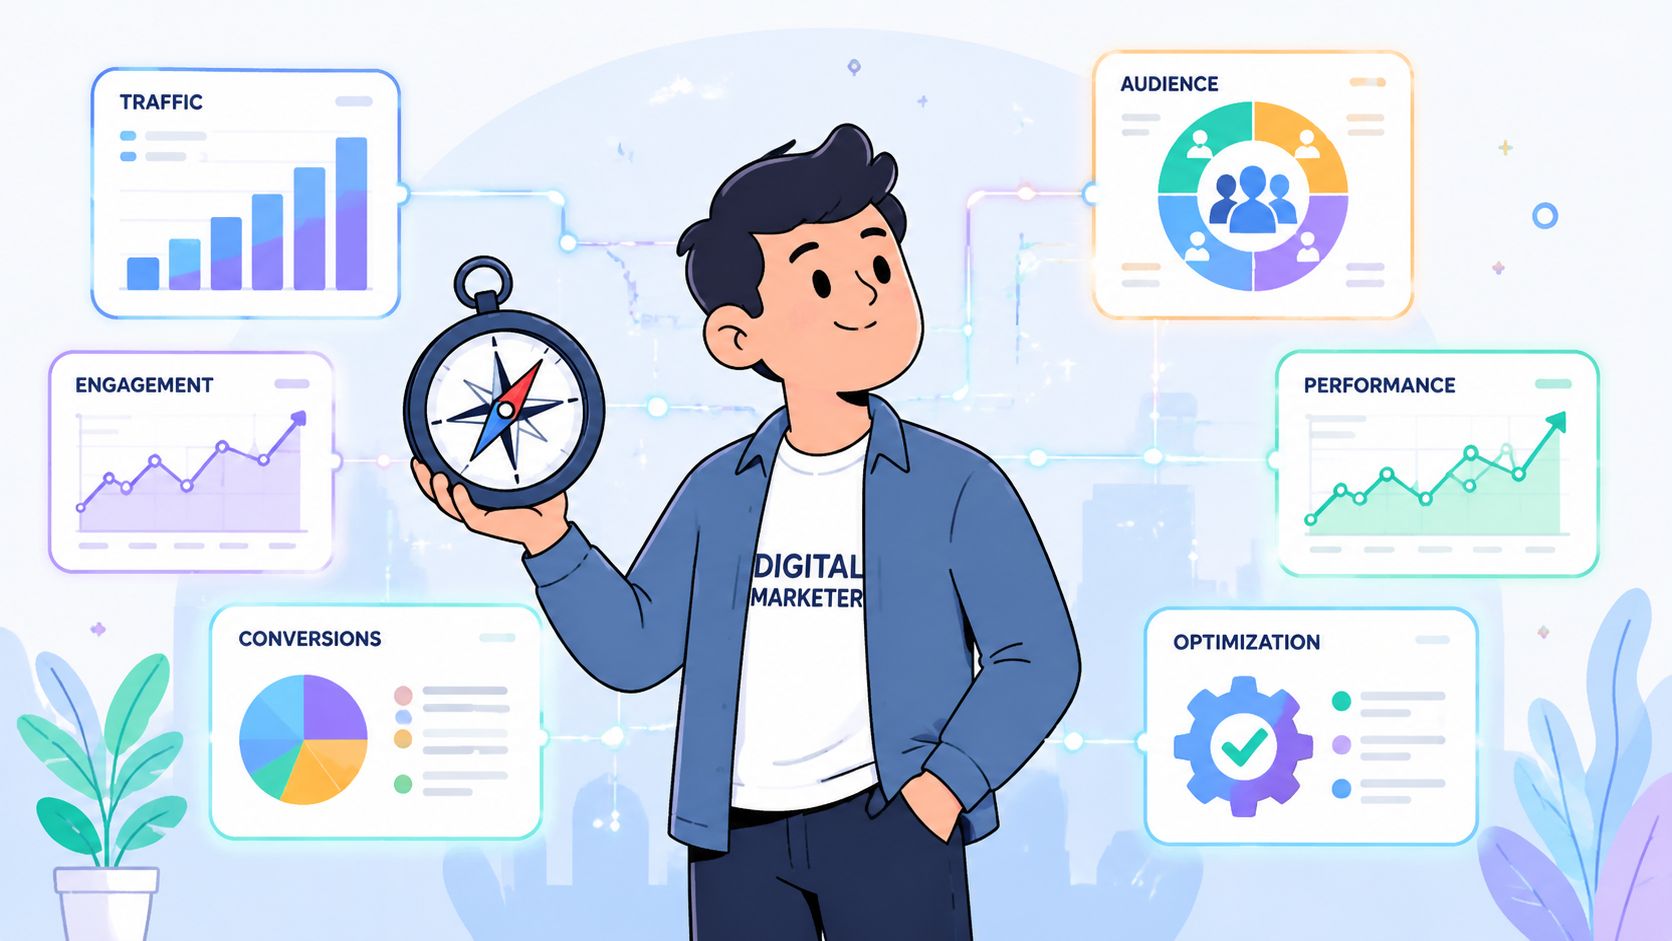
In 2024, 95% of marketing professionals rated their data-driven strategies as at least somewhat successful, but success depends on whether the data changes business outcomes, not just reporting dashboards. Data driven digital marketing becomes effective when teams connect clean collection and attribution with experiments that reveal causal impact.
That distinction matters because a campaign can receive credit for conversions without creating any additional demand. A branded-search ad may appear before a purchase because an interested buyer was already close to converting. A last-click report can call that interaction successful, while an incrementality test may show that many of those conversions would have happened without the ad. The practical challenge is to build a measurement system that separates useful signals from flattering noise.
Why Data Driven Marketing Changed Everything
95% of marketing professionals considered their data-driven strategies successful, according to a 2024 worldwide survey. The remaining responses described those strategies as ineffective, showing how widely data-driven marketing has entered day-to-day operations. (Statista data on marketing areas influenced by data and audience information)

Reported success, however, is not the same as proven incremental revenue. A marketing manager may see higher click-through rates, lower reported acquisition costs, or more conversions in an attribution platform and reasonably conclude that the strategy works. Those signals can mislead when the people counted in the report were already likely to buy.
Adoption is broad, but maturity varies
The survey shows that marketers apply data most often to channels close to customer action. Email marketing was identified as the most useful area by 47% of respondents, followed by customer experience at 46% and paid advertising at 41%. (Statista data on marketing areas influenced by data and audience information)
Each channel creates useful operating signals. Email systems can adapt messages using engagement and purchase history. Experience teams can locate abandonment points in a customer journey. Paid media platforms can adjust bids and audiences from behavioral data. These systems describe what happened, but they do not by themselves establish what the activity caused.
That distinction changes how a measurement stack should be built. Attribution is a receipt that assigns credit among recorded touchpoints. Incrementality is a counterfactual test that asks whether the outcome would have occurred without the marketing exposure. A channel can receive substantial attributed credit while producing little additional demand, especially when it reaches people already close to conversion.
The financial scale makes that distinction harder to ignore. Digital advertising is projected to reach $786.2 billion globally by 2026, compared with a projected $740.3 billion in 2024. Search advertising remains the largest segment, with a projected volume of $202.4 billion. (Digital marketing statistics and projections)
Practical rule: As media budgets grow, measurement must answer the counterfactual. Every channel can produce a persuasive report. Analysts need to estimate what would have happened without the channel.
AI-supported decision-making adds speed, not automatic validity. Nearly half of marketers in the cited survey used AI moderately or extensively in data-driven efforts, while one-quarter reported no AI use. (Statista data on marketing areas influenced by data and audience information) AI can detect patterns quickly, but it cannot correct vague event definitions, duplicated conversions, or a model that treats correlation as causation.
Understanding the Core Framework
A useful way to understand data-driven marketing is to compare it with a navigation system. A GPS doesn't choose a route from one signal. It combines your destination, current traffic, and information about previous routes, then updates its recommendation as conditions change.
Marketing works the same way. Your destination is a business objective, such as qualified pipeline, retained customers, or profitable revenue. Your traffic data is the current behavior of visitors and customers. Your route history is the record of campaigns, audiences, offers, and experiments that shaped previous outcomes.

The three layers
First-party data collection gives you information your organization observes directly. Website events, CRM records, email engagement, product usage, and declared preferences can help describe who interacts with your business and what they do. Good collection starts with a clear event dictionary. Define what counts as a lead, an opportunity, a purchase, an activated account, and a retained customer before a campaign launches.
Attribution connects reported outcomes to marketing touchpoints. It helps a paid-search manager compare campaigns, helps an email team identify engaged audiences, and helps a content team understand which assets appear in customer journeys. Attribution is useful for tactical decisions, but it generally describes observed relationships rather than proving that a touchpoint created the outcome.
Continuous optimization turns measurement into action. The team forms a hypothesis, changes one meaningful variable, observes the result, and records what happened. Testing isn't a one-time exercise. It creates a feedback loop in which campaign decisions become more precise over time.
Teams often confuse analytics-driven work with data-driven marketing. Analytics can tell you what happened and, with stronger modeling, what may happen next. Data-driven marketing also requires a decision system that determines what action to take and how to validate that action.
A strong operating model uses descriptive reporting for visibility, predictive analysis for prioritization, and causal testing for investment decisions. Tools that expose structured functions and actions, such as the MCP server tool concepts, can also help technical teams connect data workflows to repeatable operational tasks. The technology matters, but the principle comes first: collect information for a defined decision, measure the outcome against a clear baseline, and test whether the activity caused the change.
Building Your Data Collection and Measurement Stack
A measurement stack should resemble a layered system, not a pile of disconnected tools. The bottom layer records customer interactions. The middle layer interprets those interactions and tests decisions. The top layer helps people activate audiences, allocate resources, and report outcomes.
Start with trustworthy inputs
First-party data usually begins in systems your organization controls:
- CRM records: Store lead status, opportunity progression, customer ownership, and revenue outcomes.
- Website analytics: Capture page views, form interactions, product exploration, and conversion events.
- Marketing automation: Manage email journeys, audience rules, lead routing, and campaign responses.
- Product or service data: Connect marketing activity with activation, usage, renewal, or repeat purchase behavior.
Behavioral signals add context. A visitor who reads several product pages and returns through a branded search has a different likely intent from someone who views one blog post. The system shouldn't treat those behaviors as identical, and it shouldn't collect them without explaining how the data will be used.
Connect interpretation to activation
The middle layer includes analytics, experimentation, attribution software, and data warehouses. A customer data platform can unify profiles, while a warehouse can provide a stable environment for joining campaign, CRM, and revenue data. Attribution tools can support rapid channel decisions. Testing systems can create controlled comparisons. AI analytics can help identify anomalies or useful segments, but analysts still need to verify definitions and business meaning.
The activation layer turns findings into action. It may include email audiences, advertising platforms, personalization systems, sales alerts, and executive dashboards. A clean connection between these layers prevents a common failure: the media platform reports a conversion, but the CRM never confirms whether that conversion became a qualified opportunity.
Teams evaluating social and professional-channel reporting can use a focused reference such as LinkedIn analytics tools, then connect those observations to broader campaign and revenue records. For wider integration planning, review this guide to marketing data integration.
Use this audit before adding another platform:
- Define the outcome: Write the business result the system must measure.
- Map the journey: List each event from first interaction to revenue or retention.
- Check identity rules: Confirm how anonymous visits, known contacts, and duplicate records are reconciled.
- Inspect ownership: Assign responsibility for event definitions, data quality, and dashboard maintenance.
- Create a validation plan: Decide which findings require an experiment before budget changes.
A strong tech stack can't compensate for inconsistent naming, missing conversion stages, or unowned data.
Attribution Modeling vs Incrementality Testing
Attribution answers a tactical question: which touchpoints received credit for observed conversions? Incrementality asks a harder question: how many conversions happened because of the campaign that wouldn't have happened otherwise?
Those questions overlap, but they aren't interchangeable. A user might click a retargeting ad after visiting your site several times, then purchase. A multi-touch model may distribute credit across the ad, email, organic search, and direct visit. That distribution can help compare journeys, but it doesn't establish what would have happened if the retargeting ad had never appeared.
A large field study examined 12 Facebook advertising experiments involving 435 million users and found that commonly used observational approaches often failed to recover the true effect measured by randomized experiments. The finding is a direct warning against treating post-exposure tracking as proof of causal impact. (Marketing Science study on observational attribution and randomized experiments)
Use each method for the right decision
| Measurement method | What it tells you | Best use |
|---|---|---|
| Attribution modeling | How observed credit is distributed across touchpoints | Tactical campaign and journey analysis |
| Incrementality testing | Whether exposure produced additional outcomes | Budget decisions and causal validation |
| Marketing mix modeling | How broader investment relates to strategic performance | Portfolio and allocation planning |
Attribution is fast and useful for diagnosis. It can show that one creative, audience, or landing page appears more often in successful journeys than another. Use it to generate hypotheses, not to declare final causality.
Incrementality testing uses a control condition. A geo-holdout, audience holdout, or another randomized design separates exposed and unexposed groups, then compares their outcomes. The difference estimates the conversions that wouldn't have occurred without the campaign. Independent guidance describes geo-holdouts and randomized holdout designs as the gold standard for estimating incremental lift. (Research on marketing measurement and randomized holdout designs)
A practical stack uses all three approaches. Attribution helps the team optimize daily execution. Incrementality validates whether a channel deserves continued investment. Marketing mix modeling supports broader allocation when many channels and external factors interact. To deepen the mechanics, see this guide to marketing attribution modeling and use a resource on how to find the right attribution model for the decisions your team makes.
This video offers a visual explanation of the distinction:
Audience Segmentation and Personalization at Scale
Segmentation turns a customer list into a set of meaningful decisions. The basic mistake is to treat demographics as the strategy. Age, location, company size, or job title can describe an audience, but behavior often gives you a clearer indication of what someone needs next.
Start with a simple framework. RFM analysis, based on recency, frequency, and monetary value, can separate recent high-value customers from inactive buyers or occasional purchasers. The segments don't need elaborate labels. A team might create a reactivation journey for lapsed customers, a retention program for frequent customers, and a cross-sell message for customers who buy one category repeatedly.
Behavioral segmentation adds intent. A software company could distinguish between visitors who read educational content, visitors who compare pricing, and existing users who explore an advanced feature. Each group needs a different message. The first may need proof and education. The second may need implementation details. The third may need a product prompt or support from sales.
Choose the model that fits the decision
Lookalike audiences help advertising platforms find people who resemble a source audience. They can expand reach, but the quality of the source list determines the quality of the expansion. Don't build a lookalike from every lead if many leads never become qualified opportunities.
Propensity models estimate the likelihood of an action, such as purchase, renewal, or response. They can prioritize sales follow-up or tailor lifecycle messages, but analysts should monitor whether the model favors historical patterns that no longer apply.
Predictive segmentation combines behavior, customer attributes, and outcome history to identify future value or risk. It becomes useful when the organization has consistent records and a clear action for each segment.
Personalization should feel relevant, not invasive. Use information customers knowingly provide, explain value through the experience, and avoid targeting that exposes sensitive inferences. First-party data supports this balance because the organization can define collection, consent, access, and retention rules directly.
A practical decision rule is simple:
- Limited data and limited resources: Begin with lifecycle stages and recent behavior.
- Reliable transaction history: Add RFM groups and product-based journeys.
- Mature CRM and outcome records: Test propensity scoring and predictive audiences.
- Complex customer journeys: Combine segments with experiments to verify business impact.
The segment isn't the finish line. It exists to support a message, offer, experience, or prioritization decision that you can measure.
Optimization Workflows and KPI Selection
A campaign dashboard can show hundreds of metrics and still fail to guide a decision. The remedy is a workflow that connects a business objective to a small set of meaningful signals, then gives the team a defined response when performance changes.
Begin with the outcome. For lead generation, the primary measure might be qualified opportunities rather than form submissions. For brand visibility, the team may track reach or branded demand, but it should also define how awareness activity supports later business outcomes. For retention, renewal or repeat usage matters more than email engagement alone.
Build a decision loop
- State the hypothesis: For example, a more specific landing-page promise will increase qualified requests from high-intent visitors.
- Choose the primary KPI: Select the outcome that determines whether the test succeeded.
- Add guardrails: Monitor lead quality, cost, unsubscribe behavior, or customer experience so a short-term gain doesn't create a larger problem.
- Run the comparison: Use an A/B test when traffic can be divided fairly, a multivariate design when interactions between several elements matter, or a controlled holdout when causal channel impact is the question.
- Record the decision: Keep the hypothesis, audience, dates, result, and next action in a shared experiment log.
A/B testing works well for a focused change, such as headline, form length, or email content. Multivariate testing can evaluate combinations, but it demands careful planning because many combinations can dilute the available observations. Automated bidding can react quickly to platform signals, though the team still needs to verify that the platform's optimization event reflects business value.
Separate leading from lagging indicators
Leading indicators show whether the system is moving in the expected direction. Examples include qualified page engagement, sales-accepted leads, or progression to a meaningful product action. Lagging indicators confirm the final result, such as closed revenue, renewal, or contribution margin.
Measurement discipline: Choose a KPI because someone will make a decision from it. If nobody knows what action follows a metric, it belongs in background reporting, not the executive scorecard.
A useful dashboard can combine channel diagnostics, funnel progression, experiment status, and anomaly alerts. Teams can use a practical resource on measuring marketing effectiveness to connect these elements to business outcomes. ReachLabs.ai is one example of a marketing partner that describes campaigns around lead generation, brand visibility, tracking, and actionable data interpretation.
Avoid declaring a winner from a noisy early result. Check audience balance, event quality, test exposure, and whether the measured outcome has enough time to develop. The most valuable optimization culture isn't the one that changes campaigns constantly. It's the one that learns reliably and makes each change for a stated reason.
Successful Campaign Examples and Lessons
The supplied brief doesn't provide verified case studies or outcomes for named campaigns, so responsible analysis must avoid invented conversion lifts, cost reductions, or return figures. Instead, use two operating examples that show how a team should structure the work without pretending that the scenarios produced measured results.
A B2B lead-generation workflow
A B2B team starts with a generic audience and records visits, content engagement, form completion, qualification, sales acceptance, and opportunity creation. Analysts notice that visitors who return to solution pages behave differently from visitors who only consume introductory content. The team creates a hypothesis: routing high-intent visitors to a more specific offer will improve lead quality.
The test compares the revised experience with the existing one. The primary KPI is sales-accepted opportunity creation, while form completion remains a diagnostic metric. If submissions rise but sales acceptance doesn't, the team rejects the apparent win and investigates qualification or message fit.
A brand-visibility workflow
A brand team sees strong platform-reported engagement across several channels, but it doesn't know which exposure creates additional demand. It sets up a randomized holdout or geo-based comparison, defines the business outcome in advance, and compares exposed areas with an appropriate control group. Attribution remains useful for understanding creative and journey behavior, while the holdout determines whether the investment generated additional results.
The transferable lessons are consistent:
- Begin with a hypothesis: Don't launch a campaign without specifying what should change.
- Use the right baseline: A before-and-after comparison alone can confuse campaign impact with seasonality or other changes.
- Protect the outcome: Optimize toward qualified business results, not the easiest event to generate.
- Document null results: A failed test can prevent repeated spending on an attractive but ineffective tactic.
The Future of Data Driven Marketing
AI adoption is moving data-driven marketing from reporting toward faster prediction and activation. A 2025 global survey found 17% of marketing professionals used AI extensively, 39% used it in selected areas, and 26% were still exploring it in data-driven marketing. (Digital marketing statistics and projections)
The next advantage won't come from adding AI to an unstructured stack. It will come from reliable first-party data, privacy-aware activation, clear experimentation, and teams that understand causal measurement. Organizations that build those capabilities can use automation without surrendering judgment.
Start by auditing your event definitions, choosing one business outcome, and designing a holdout test for a meaningful channel. Then connect the result to budget decisions, not just a presentation.
ReachLabs.ai offers digital marketing campaigns for goals such as lead generation and brand visibility, supported by campaign tracking and data-driven decision workflows. Visit ReachLabs.ai to discuss how a measurement stack can turn your marketing data into tested, actionable growth decisions.