
At its heart, marketing analytics is the practice of measuring and analyzing your marketing efforts to make them better. It’s how you figure out what’s actually working, what’s a waste of money, and how to get the best possible return on your investment (ROI).
Think of it as switching from navigating by instinct to using a GPS. It moves marketing from a "gut feeling" art form into a science of smart, calculated decisions.
Moving From Guesswork to Growth
Every marketer has great ideas. Those ideas are the fuel, the creative spark that gets everything moving. But without a way to measure the results, you're just throwing things at the wall and hoping something sticks. That's where analytics comes in.
It's the navigation system for your marketing ship. It tells you which channels are just choppy water and which ones are clear sailing to your best customers. It helps you spot wasted ad spend before it sinks your budget and shows you the most direct route to hitting your goals. Instead of just hoping your last campaign did well, you'll know exactly how it performed.
In short, marketing analytics is all about answering the tough questions: Where are our best customers coming from? What’s our real cost to bring in a new lead? Which blog posts or videos actually get people to click ‘buy’?
The Power of Data-Driven Decisions
When you have solid answers to these questions, everything changes. You stop guessing where to put your budget and start investing it with confidence. You can quickly pull the plug on a failing campaign and double down on a winner, making your marketing dollars work much, much harder.
This is the foundation of smart, sustainable growth. A great way to dig deeper into this mindset is by understanding how to build a data-driven marketing strategy.
The industry's rapid expansion tells the same story. The global marketing analytics market is currently valued at USD 8.02 billion and is expected to reach USD 14.55 billion by 2031. That's a huge annual growth rate of 12.65%. The fact that cloud-based tools make up over 62% of the market share shows that powerful analytics are more accessible than ever for businesses of all sizes. You can see more details in these marketing analytics market trends.
So, what is marketing analytics? It’s the essential bridge connecting what you do in your marketing to what you achieve as a business. It ensures every dollar spent is an investment, not just an expense.
The Four Pillars of Marketing Analytics: A Simple Framework
To really get a handle on marketing analytics, it helps to see it as a structure built on four essential pillars. These aren't just separate concepts; they work together, turning a confusing mess of raw data into a powerful engine for smart, strategic growth. Each pillar builds on the one before it, creating a clear framework you can use to measure what’s happening, manage your efforts, and actually improve your marketing.
This simple map shows the core idea in action: you measure, you analyze, and you use what you learn to make better decisions next time.
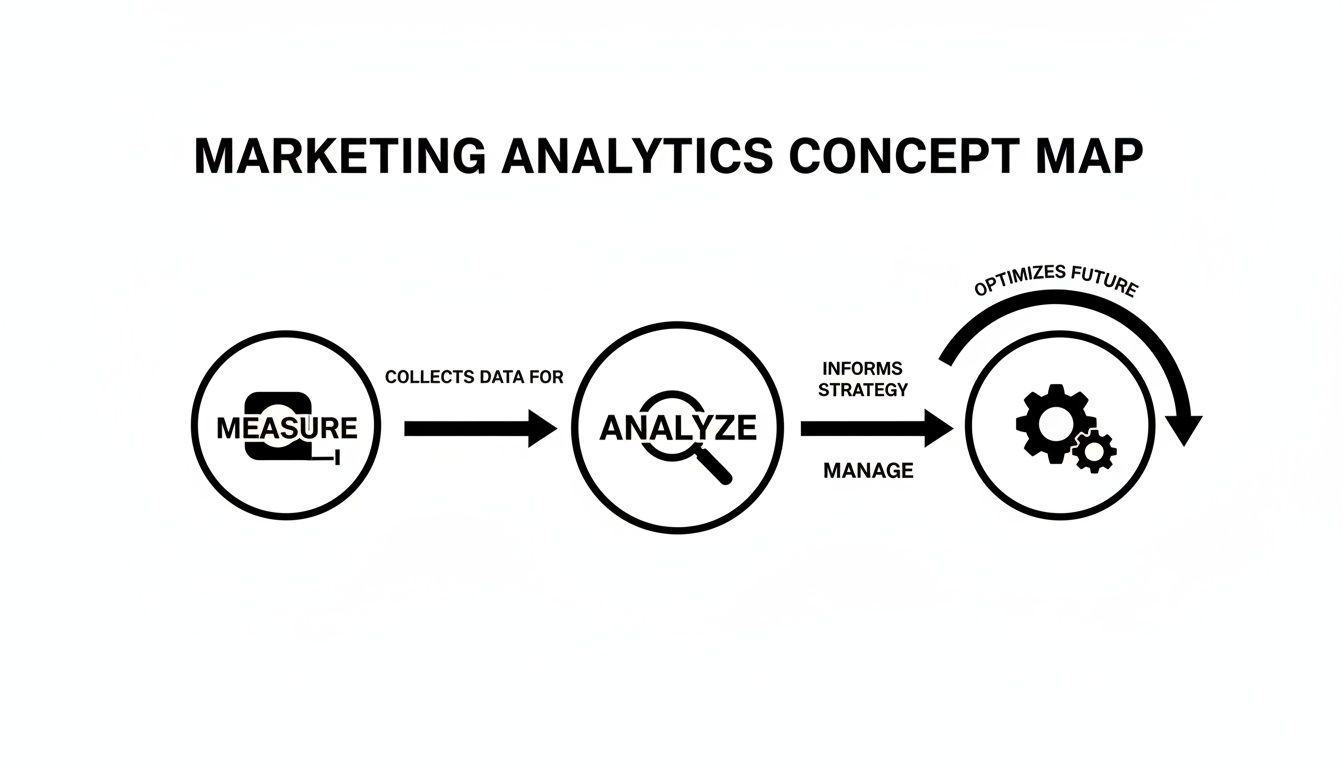
It’s a constant loop, not a one-and-done report. This cycle of refinement is where the real magic happens.
Pillar 1: Data Collection
Everything, and I mean everything, starts with data. This is the raw material for every single insight you’ll ever uncover. Think of it like cooking: the quality of your final dish is completely dependent on the quality of the ingredients you start with.
Data flows in from all over the place, and each source gives you a different piece of the customer puzzle.
- Website Analytics: Tools like Google Analytics are your eyes on your website, tracking how visitors behave—what pages they see, how long they stick around, and the paths they take to a conversion.
- CRM Systems: Your Customer Relationship Management (CRM) platform is a goldmine of information on leads, every customer interaction, and the entire sales cycle.
- Social Media Platforms: The native analytics inside Meta, LinkedIn, and other channels tell you all about engagement, reach, and who your audience really is.
- Email Marketing Software: This is where you find out who’s opening your emails, what they’re clicking on, and how subscribers are behaving.
The golden rule here is simple: "garbage in, garbage out." If your data is messy, incomplete, or just plain wrong, any analysis you do on top of it will be fundamentally flawed. Nailing down clean, organized data collection is the absolute, non-negotiable first step.
Pillar 2: Performance Measurement
Once you have good data, the next job is to measure what actually matters. It's incredibly easy to get sidetracked by vanity metrics—things like social media likes or a spike in website visitors. They look impressive on a chart but often have zero connection to the health of your business.
Real performance measurement zeroes in on Key Performance Indicators (KPIs) that are tied directly to your business goals. These are the numbers that tell you if your marketing is actually moving the needle.
A Key Performance Indicator is a measurable value that demonstrates how effectively a company is achieving key business objectives. Marketers use KPIs to evaluate the success of their campaigns.
So, instead of just tracking website traffic, a savvy marketer focuses on metrics like these:
- Customer Acquisition Cost (CAC): On average, how much are you spending to bring in a new customer?
- Customer Lifetime Value (LTV): How much revenue does the average customer generate over their entire relationship with you?
- Conversion Rate: What percentage of people are taking the action you want them to, like making a purchase or filling out a form?
Focusing on the right KPIs changes the conversation from "How many people saw our ad?" to "How much revenue did our ad generate?" It’s a game-changer.
Pillar 3: Attribution Modeling
This pillar tackles one of the oldest and most frustrating questions in marketing: "Which of my efforts are actually working?" Attribution modeling is just a fancy term for figuring out how to give credit to the different marketing touchpoints a customer interacts with on their way to becoming a customer.
Think of it like a soccer goal. The striker gets the glory, but they didn't do it alone. The defender stole the ball, a midfielder made a great pass, and then the striker scored. Attribution helps you see the value of the defender and the midfielder, not just the final kick.
A few common attribution models include:
- First-Touch Attribution: Gives 100% of the credit to the very first ad, email, or blog post a customer ever saw.
- Last-Touch Attribution: Assigns 100% of the credit to the final touchpoint right before the conversion. Simple, but often misleading.
- Multi-Touch Attribution: Spreads the credit across multiple touchpoints, acknowledging that the whole journey matters.
Picking the right model is critical. It helps you see the true value of each channel and stops you from cutting the budget for a campaign that’s playing a crucial "assist" role behind the scenes.
Pillar 4: Data Visualization
The final pillar is all about communication. A massive spreadsheet full of numbers is intimidating and almost impossible for most people to make sense of. Data visualization is the art of turning those complex numbers into clear, compelling stories that anyone on your team can understand at a glance.
This is where dashboards and reports shine. Using tools like Tableau, Looker Studio (formerly Google Data Studio), or even the built-in dashboards in your software, you can create visual snapshots of your KPIs. A great dashboard instantly shows you how a campaign is doing, highlights a trend you might have missed, and points a big red arrow at problems that need your attention.
Good visualization isn't just about making pretty charts. It’s about making data accessible, understandable, and most importantly, actionable. It gives your team the confidence to make quick, informed decisions, which closes the analytics loop and lets you constantly improve based on what the data is telling you.
7. Exploring Essential Analytics Tools and Techniques
Knowing the theory behind marketing analytics is a great start, but to actually do anything with it, you need the right set of tools. Think of it like a mechanic’s workshop—you need specific wrenches, lifts, and diagnostic machines to get the job done right. For a marketer, this workshop is filled with digital tools that let you take apart campaign performance, see what’s working, and fix what isn’t.
These tools are the bridge that connects mountains of raw data to the clear, actionable insights you need to make smart decisions. The market is full of options, from sprawling platforms that track every single website visitor to niche software designed purely for making your data look good in a chart. Each one gives you a different window into the customer journey.
Core Categories of Analytics Tools
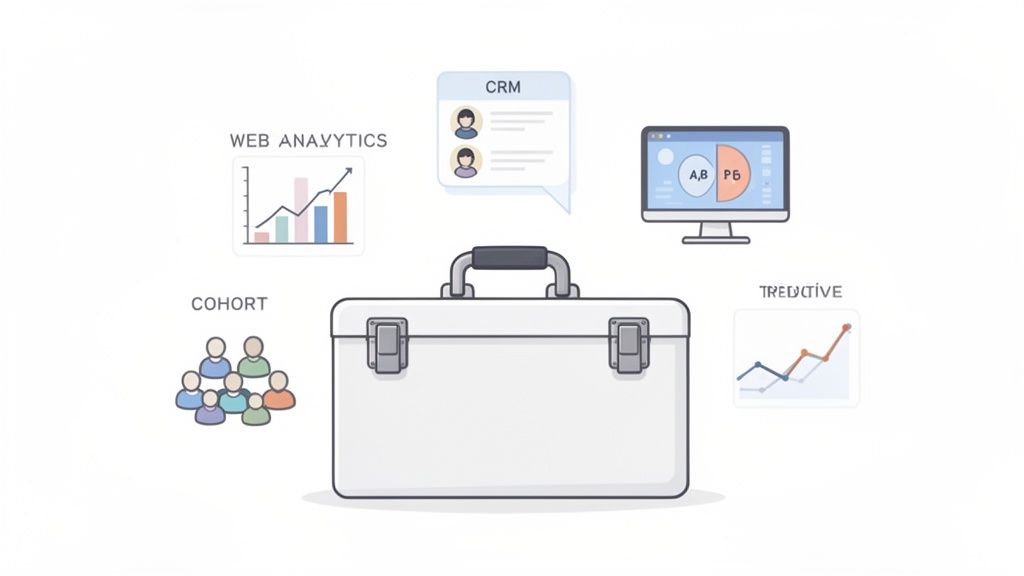
To avoid getting overwhelmed, it helps to sort these tools into three main buckets. Each one provides a different, but equally important, perspective on your marketing performance.
- Web Analytics Platforms: This is your foundation. Tools like Google Analytics track everything happening on your website and apps—how people find you, what they click on, and where they give up and leave.
- Customer Relationship Management (CRM) Systems: A CRM takes you from anonymous clicks to real people. It tracks interactions with known leads and customers, connecting your marketing efforts directly to sales and showing the full story from first touchpoint to final purchase.
- Data Visualization and BI Tools: These platforms are your storytellers. They take overwhelming spreadsheets and turn them into dashboards and reports that make sense at a glance, helping you spot trends and share your findings with people who aren’t data nerds.
Here’s a simple way to think about it: Web analytics tells you what happened. A CRM tells you who it happened to. And a BI tool helps you tell the story of why it all matters.
A great place to start is by getting comfortable with your Google Analytics organic search data. Mastering this is a fundamental skill that underpins almost every other analytics strategy.
Powerful Techniques to Turn Data Into Action
Just having the tools isn’t enough. The real magic happens when you know the right techniques to unlock the insights hidden inside your data. This is what separates marketers who just report on numbers from those who actually move the needle.
One of the most effective techniques is A/B testing. It’s a straightforward concept: you create two versions of something—a webpage, an email, or an ad—and change just one thing, like the headline or the button color. By showing each version to a different group of people, you get definitive proof of what works best. No more guesswork.
Another powerful method is cohort analysis. This involves grouping your users based on a shared characteristic, like the month they signed up. By tracking these groups over time, you can see if customers you acquired during a specific campaign are more loyal or valuable than others, which is incredibly useful for planning future promotions.
Predictive analytics takes this a step further, using historical data and machine learning to make educated guesses about the future. It can help you identify which leads are most likely to buy, so your sales team can focus their energy where it counts. For a closer look at specific tools, our guide to the best social media analytics tools is a great resource.
Artificial intelligence is making these techniques more powerful than ever. In fact, 63% of marketers are already using generative AI to improve their workflows. AI can sift through huge amounts of data from social media, paid ads, and influencer campaigns to spot top-performing content and find better quality leads. With the U.S. paid search market now worth a staggering $124.59 billion, the ability to analyze metrics like click-through rates and conversions is absolutely essential for getting a good return on your investment. You can see more on these trends in the latest marketing statistics from Salesforce.
Comparing Popular Marketing Analytics Tools
With so many tools on the market, choosing the right one can feel daunting. The best tool for a solo creator won't be the same as what a large enterprise team needs. This table breaks down some of the most common options to help you find the right fit.
| Tool Category | Example Tools | Best For | Key Feature |
|---|---|---|---|
| Web Analytics | Google Analytics, Adobe Analytics | Businesses of all sizes | Tracking website traffic, user behavior, and conversion funnels. |
| CRM & Customer Data | HubSpot, Salesforce | Sales & Marketing Teams | Connecting marketing touchpoints to customer and sales data. |
| BI & Visualization | Tableau, Google Data Studio | Data Analysts & Managers | Creating interactive dashboards and visual reports from multiple data sources. |
| Social Media Analytics | Sprout Social, Hootsuite | Social Media Managers | Monitoring engagement, tracking brand mentions, and analyzing audience growth. |
Ultimately, the goal isn't to use every tool available. It's about building a "stack" that gives you a complete, 360-degree view of your marketing performance—from the first ad click to the final sale.
Putting Your First Marketing Analytics Strategy into Action
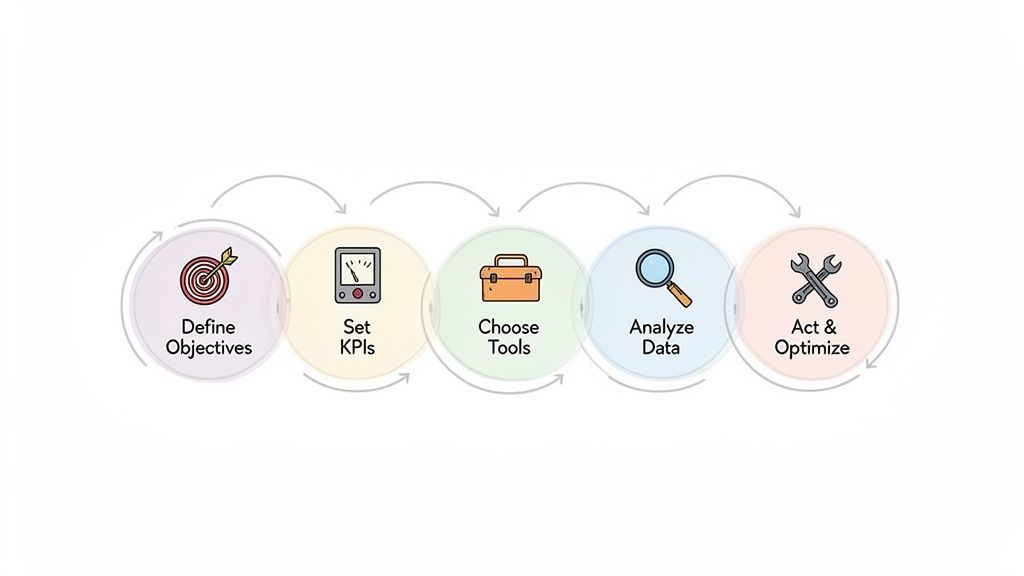
Making the jump from theory to practice with marketing analytics can feel a bit daunting. But here's the good news: you don't need a Ph.D. in data science to get started. A truly effective strategy is built on a simple, repeatable framework that connects your big-picture business goals to tangible, measurable actions.
Think of it like building a piece of furniture from IKEA. You start with a clear picture of the finished product (your objective), find the right parts and tools (your KPIs and software), and then follow the instructions to build, test, and tweak it until it's perfect. Let’s walk through how that works.
Step 1: Define Your Core Business Objectives
Before you even think about tracking a single click or email open, you have to answer the most important question of all: What are we actually trying to achieve? Without a clear destination, your analytics GPS is completely useless. And I'm not talking about fuzzy marketing goals; I mean real business outcomes.
Are you trying to grow overall revenue? Do you need to generate more high-quality leads for your sales team to close? Or is the number one priority to keep the customers you already have? The answer to that question will steer every other decision you make down the line.
Don’t start by asking, "What data can we collect?" Instead, ask, "What problem are we trying to solve?" This simple shift in perspective ensures your analytics efforts are tied directly to what moves the needle for your business, preventing you from drowning in irrelevant data.
Step 2: Translate Objectives Into Measurable KPIs
Once you know your destination, you need signposts to tell you if you're heading in the right direction. That's where Key Performance Indicators (KPIs) come in. A good KPI is a specific, measurable number that directly shows progress toward your main objective.
This is the critical step where you turn a broad business goal into something you can actually count. It’s the bridge between your high-level strategy and the day-to-day grind of marketing.
- If your objective is to increase revenue:
- Your KPIs might be: Customer Lifetime Value (LTV), Average Order Value (AOV), and overall Conversion Rate.
- If your objective is to generate more qualified leads:
- Your KPIs might be: Cost Per Lead (CPL), Lead-to-Customer Conversion Rate, and the number of Marketing Qualified Leads (MQLs) you produce.
- If your objective is to improve customer retention:
- Your KPIs might be: Customer Churn Rate, Repeat Purchase Rate, and Net Promoter Score (NPS).
Pick just a few KPIs that are absolutely vital. It's far better to track three metrics that genuinely matter than to get lost in a sea of twenty that just create noise.
Step 3: Select and Integrate The Right Tools
Okay, now it’s time to pick your gear. The key here is to start simple and choose platforms that actually help you track the KPIs you just defined. You can build a surprisingly potent analytics setup with just a few core tools that talk to each other.
The goal is to create a seamless flow of information. What you learn from your website analytics should inform your email campaigns, and data from both should pipe into your CRM. This gives you a full 360-degree view of the customer journey. Just remember the old saying, "garbage in, garbage out"—make sure your data is clean and consistent from day one.
Your Essential Starter Toolkit:
- A Web Analytics Platform: Google Analytics is the industry standard. It's free, incredibly powerful, and perfect for understanding website traffic and user behavior.
- A CRM System: A tool like HubSpot or Salesforce is non-negotiable for tracking leads and finally connecting marketing efforts to actual sales dollars.
- Platform-Specific Analytics: Don't forget the data you already have! Use the built-in analytics from your social media and email marketing platforms to see how individual channels are performing.
Step 4: Analyze the Data and Act on Insights
This is where all the work pays off. Collecting data is passive, but analyzing it is an active hunt for the story hidden in the numbers. Look for patterns, trends, and weird outliers. Ask sharp questions like, "Why did that one blog post suddenly drive 50% of our new leads last month?" or "Why do customers who click this ad campaign have a much higher lifetime value?"
Analysis without action is just trivia. The final, most crucial step is to use what you’ve learned to make real changes to your marketing strategy. This creates a powerful feedback loop: you measure, you learn, you optimize, and you do it all over again. This iterative cycle is the engine that drives true data-backed growth.
Seeing Marketing Analytics In Action
It’s one thing to talk about marketing analytics in theory, but it’s another thing entirely to see it change a business. This is where the rubber meets the road. Analytics isn't about getting lost in spreadsheets; it's about drawing a straight line from a specific marketing action to a real-world business result. It shows you exactly what’s working, what's a waste of money, and most importantly, why.
Let’s look at three different stories of how businesses put their data to work to make smarter decisions and spark real growth. These examples show just how versatile analytics is, working its magic everywhere from e-commerce shops to B2B software companies.
E-commerce Ad Spend Optimization
Imagine an online store selling beautiful handcrafted leather goods. They were spending a small fortune on social media ads across several platforms. Sales were coming in, but their profit margins were getting thinner and thinner. They were essentially throwing money at a wall, hoping some of it would stick, without knowing which ads were actually bringing in the best customers.
So, they dug into their web analytics, tracing every sale back to the ad that brought the customer in. What they found was a total surprise. One platform was sending them tons of clicks, but a different, much smaller platform was responsible for a whopping 75% of their high-value purchases. Customers from this overlooked source spent more per order and came back to buy again.
With this crystal-clear insight, they completely changed their ad strategy. They pulled their budget from the "clicky" but low-value platform and doubled down on the one that was actually making them money.
The Result: In just three months, the brand saw a 40% jump in total sales, and they actually reduced their overall ad spend. This is a perfect, textbook example of marketing analytics in action—using data to find the most profitable way forward.
B2B Lead Quality Enhancement
Here's another one. A B2B software company was drowning in leads from webinars and content downloads. Sounds like a good problem, right? But their sales team was completely swamped, wasting countless hours chasing down leads who were never going to buy. They needed a way to find the real prospects in a sea of dead ends.
By connecting their marketing automation tool to their CRM, they started to see what their best customers had in common. A clear pattern emerged: leads from the financial services industry were three times more likely to become paying customers than leads from any other sector.
This single piece of information changed everything. They stopped their scattergun approach and built campaigns aimed directly at finance professionals, speaking their language and solving their specific problems.
This led to a few key changes:
- Targeted Content: They created case studies and whitepapers just for the finance world.
- Ad Campaign Refinement: Their ad targeting became laser-focused on this valuable industry.
- Sales Prioritization: The sales team knew to call these leads first, every single time.
The results were stunning. Their lead-to-customer conversion rate tripled. The sales team was happier and far more effective because they were finally spending their time on conversations that mattered. To get a better sense of how this kind of data becomes a strategy, check out these sample marketing reports.
Proving Influencer Campaign ROI
Finally, let's look at a beverage company that was running a big influencer marketing campaign. In the past, they just counted likes and comments—vanity metrics that don't pay the bills. This time, they wanted to prove that their investment was actually paying off.
They got smart with their analytics. Each influencer was given a unique, trackable link and a special discount code. This allowed the company to see exactly how much traffic and how many sales each influencer was directly responsible for. They also used social listening tools to see if the online chatter about their brand was positive or negative.
The data told the full story. They could now see which influencers were true partners who drove sales, not just the ones who got the most likes. This allowed them to build smarter, more profitable influencer relationships for all future campaigns.
The Payoffs and the Pitfalls: What to Watch Out For
Jumping into marketing analytics can be a game-changer, but it’s not a magic wand. Think of it less like a switch you flip and more like a skill you develop. When you get it right, the rewards are massive. Get it wrong, and you can easily find yourself lost in a sea of confusing charts and numbers.
The biggest win is simple: you stop guessing where your money should go. A solid analytics practice shows you exactly what’s working, so you can double down on the channels delivering real results and cut the ones that are just eating up your budget. This immediately boosts your return on investment (ROI) and leads to smarter, more efficient spending.
Beyond just the budget, analytics helps you get inside your customers' heads. You can finally move past assumptions and see what people actually do, what they care about, and where they get stuck. This insight is gold for creating campaigns that genuinely connect.
The Upside: Gaining a Serious Edge
When you ground your decisions in data, you gain a massive advantage. While your competitors are operating on gut feelings, you can react to market shifts with speed and confidence. This agility lets you pounce on new opportunities and squash problems before they grow.
Ultimately, this is about turning your marketing department from a cost center into a predictable growth engine. You get the hard evidence needed to justify your budget and prove your team's direct impact on the bottom line.
Common Pitfalls That Can Derail You
Of course, the path to data-driven success has its share of traps. One of the most common is the siren song of vanity metrics. It feels great to see a huge spike in website traffic or a thousand new social media followers, but if those numbers don't translate into actual sales or leads, they're just noise.
Another classic mistake is data overload. There are countless tools spitting out endless data points, and it’s incredibly easy to get overwhelmed. This leads straight to "analysis paralysis," where you spend all your time collecting reports but never actually do anything with the information.
The key is to sidestep these issues by focusing ruthlessly on the numbers that directly impact your business goals.
Here’s how to stay on the right path:
- Stick to Actionable KPIs: Zero in on metrics that matter, like Customer Acquisition Cost (CAC) and conversion rates, instead of surface-level stats.
- Start Small, Then Build: Don't try to measure everything from day one. Pick one important goal, get comfortable with the process, and expand from there.
- Data Informs, It Doesn't Dictate: Analytics should guide your creativity, not replace it. The most powerful marketing happens when great ideas are backed by solid data.
Your Marketing Analytics Questions, Answered
Jumping into marketing analytics can feel like staring at a wall of numbers. It’s completely normal to have a few questions before you get comfortable.
Think of this section as your quick-start guide. We'll tackle some of the most common hurdles marketers face, giving you clear, simple answers so you can start putting your data to work.
How Do I Start With Marketing Analytics On A Small Budget?
You don't need a massive budget to get started—in fact, starting lean is often smarter. The best first step is to master the powerful free tools already at your fingertips. Google Analytics is non-negotiable for understanding how people find and use your website.
Beyond that, every social media platform has its own built-in analytics. Dig into Meta Business Suite or LinkedIn Analytics to see what content is actually resonating. You can pull the most important numbers into a simple Google Sheet to track your key performance indicators (KPIs) manually. The trick is to focus on one or two crucial business goals and ignore everything else.
What Is The Difference Between Marketing Analytics And Business Intelligence?
This is a great question, and the answer comes down to scope. Marketing analytics is hyper-focused on one thing: measuring and improving marketing efforts. It answers questions like, "Did our last email campaign actually lead to sales?" or "Which social media channel brings us the best leads?"
Business Intelligence (BI) is the big picture. It pulls data from every corner of the company—sales, finance, operations, HR—to give a holistic view of the organization's health.
Think of it this way: Marketing analytics is like putting a single campaign under a microscope. BI is like looking at the entire company from a satellite. Your marketing data is a critical piece of that bigger picture, feeding into the BI system to provide context.
How Often Should I Review My Marketing Analytics Data?
There's no single right answer here; it really depends on what you're measuring. The cadence should match the pace of your marketing activities.
Here’s a good rule of thumb:
- Daily Checks: If you're running paid ad campaigns with a daily budget, you need to be looking at metrics like click-through rate (CTR) and cost-per-acquisition (CPA) every day. A small problem can become a big, expensive one fast.
- Weekly Reviews: For long-term plays like SEO and content marketing, a weekly check-in is perfect. It’s frequent enough to spot trends but keeps you from making knee-jerk reactions to normal daily dips and spikes.
- Monthly or Quarterly Reports: Big-picture thinking happens here. Set aside time each month or quarter to review how marketing is impacting major business goals like overall revenue and customer lifetime value.
The key is to find a rhythm that helps you take action, not just stare at dashboards. You want to check in often enough to make smart adjustments but not so often that you get lost in the noise.
Ready to transform your data into a predictable growth engine? ReachLabs.ai integrates world-class talent with data-driven insights to deliver strategies that move the needle. Stop guessing and start growing by visiting https://www.reachlabs.ai.


