
Monitoring conversion metrics isn’t just a task you check off a list; it’s the very pulse of your marketing efforts. It’s the active, ongoing process of tracking, analyzing, and then acting on the data that shows whether people are doing what you want them to do. This practice is what separates businesses that guess their way forward from those that build predictable, scalable growth.
Frankly, without it, your marketing budget is just a shot in the dark.
Why Blindly Spending on Marketing Is a Losing Game
Throwing money at campaigns without clear data is like driving with a blindfold on. Sure, you might move forward, but you’re bound to hit a few walls, and the journey will be incredibly inefficient and expensive. Diligently monitoring your conversion metrics is the only reliable way to understand what’s truly working and pave a clear path to sustainable growth.
When you ignore this, the consequences are both predictable and damaging. You might find yourself pumping more and more budget into a campaign that generates a lot of clicks but zero qualified leads. Even worse, you could overlook a high-performing channel that, with just a small boost in funding, had the potential to scale your entire business.
Understanding the Core Language of Conversion
To really get a handle on this, you need to speak the language of conversion. This isn’t about memorizing jargon or complex formulas. It’s about deeply understanding what each key metric is telling you about the health of your business. Think of these as the vital signs for your marketing.
Here are a few of the non-negotiables:
- Conversion Rate (CR): This is the percentage of visitors who actually take the action you want them to. It’s the clearest indicator of how persuasive your landing page, ad, or offer truly is.
- Customer Acquisition Cost (CAC): This metric tells you exactly how much you’re spending, on average, to bring in a new customer. If your CAC starts creeping up, it’s a red flag that something is off with your targeting or your message.
- Return on Ad Spend (ROAS): This directly ties your advertising budget to the revenue it generates. ROAS shows you, in plain terms, which campaigns are making you money and which are just a drain on your resources.
I see it all the time: businesses get obsessed with vanity metrics like traffic or clicks. While those numbers aren’t useless, metrics like CAC and ROAS are what connect directly to your bottom line. They’re about profitability, not just activity.
To give you a better sense of how these core metrics function, here’s a quick-glance table.
Core Conversion Metrics at a Glance
This table breaks down the most critical metrics you should be tracking. Understanding these is the first step toward making data-informed decisions that fuel real growth.
| Metric | What It Measures | Why It Matters |
|---|---|---|
| Conversion Rate (CR) | The percentage of users who complete a desired action (e.g., purchase, sign-up). | It’s a direct measure of your campaign’s and landing page’s effectiveness. A higher CR means you’re getting more value from your existing traffic. |
| Customer Acquisition Cost (CAC) | The total cost of sales and marketing to acquire one new customer. | This tells you if your customer acquisition strategy is sustainable. If CAC is higher than customer lifetime value, your business model is in trouble. |
| Return on Ad Spend (ROAS) | The amount of revenue generated for every dollar spent on advertising. | It provides a clear view of which ad campaigns are profitable and which are not, allowing you to allocate your budget for maximum impact. |
Knowing what to track is crucial, but it’s the application of that knowledge that makes all the difference.
The Real-World Impact of Tracking
Consistently monitoring these metrics across all your channels isn’t just good practice; it’s fundamental to optimizing your entire business. For perspective, the average e-commerce conversion rate worldwide hovers around a modest 2%. This means even small improvements can have a huge impact.
For example, if you spend $300 on an ad campaign that brings in $1,000 in sales, your ROAS is 2.33. This means every single dollar you invested returned $2.33 in revenue. Armed with that concrete data, you can confidently shift your budget toward the campaigns that maximize profitability. Top-performing businesses live and die by this kind of analysis, which you can read more about on sites like Profit.co.
Ultimately, these numbers tell a story. They reveal what your customers are really doing, shine a light on friction points in your sales funnel, and expose your most significant growth opportunities. By paying close attention, you stop treating marketing as an expense and start treating it as what it should be: a predictable, revenue-driving investment.
Choosing the Metrics That Actually Matter for Your Business

When you first open a tool like Google Analytics, the sheer volume of data can feel like a tidal wave. It’s easy to get lost. But here’s a secret I’ve learned over years of campaign management: success isn’t about tracking everything. It’s about being ruthless in your focus on the numbers that directly link to your business goals.
Before you can effectively monitor conversion metrics, you have to get crystal clear on what a “conversion” even is for your business. It’s not a one-size-fits-all term. What an e-commerce store obsesses over is going to be completely different from the vital signs of a B2B SaaS company.
Let’s get practical. It’s time to stop chasing vanity metrics and start aligning your tracking with how you actually make money. I’ve found the best way to do this is to think in terms of two categories: macro and micro conversions.
- Macro Conversions: These are the big wins. The primary actions that directly put money in the bank or generate a high-value lead. Think of this as the final destination you want users to reach.
- Micro Conversions: These are the crucial steps along the way. Smaller engagements that signal a user is interested and moving down the path toward that macro conversion.
Matching Metrics to Your Business Model
A generic approach to tracking will only ever yield generic results. You have to get specific. The real trick is to pinpoint the exact actions that show a customer is progressing through your unique sales funnel.
For an e-commerce business, the undisputed champion of macro conversions is a completed purchase. But don’t stop there. The metrics that get you to that sale are just as important—things like Add to Cart rate, Average Order Value (AOV), and checkout completion rate. The micro-conversions? Those might be someone signing up for a “back in stock” alert or adding an item to their wishlist.
A SaaS company plays a different game; it’s all about user acquisition and long-term retention. Their primary macro conversion is almost always a paid subscription. But that rarely happens out of the blue. It’s usually preceded by a critical step-up conversion, like a free trial sign-up. The micro-conversions leading up to that point could be anything from watching a product demo to downloading a detailed case study.
I see this mistake all the time: businesses treat every sign-up as equal. For a SaaS company, lumping a free trial user in with someone who just downloaded an ebook is a huge error. The trial user has high purchase intent; the ebook downloader has initial interest. Your metrics have to show that difference.
Defining Your Core Conversion Events
If you run a Lead Generation website, your ultimate prize is a qualified lead. This is typically captured when someone fills out a “Request a Quote” or “Contact Us” form. But just counting forms isn’t enough. You need to know your cost per lead and, more importantly, your lead-to-customer rate. That second one tells you if you’re attracting quality prospects or just wasting your sales team’s time.
And what about Content Publishers, like a blog or a news site? Their goal is to build a loyal, engaged audience. A key macro conversion might be a premium content subscription. The micro-conversions are the bread and butter of audience-building:
- Newsletter sign-ups
- Ad clicks
- Time on page
- Pages per session
By defining these different tiers, you start building a measurement plan that tells a complete story. You won’t just see the final sale; you’ll understand all the small, crucial steps a user took to get there. This level of insight is absolutely essential when you need to accurately calculate marketing ROI and make a strong case for your budget. Every metric becomes a clue, helping you optimize each stage of the customer journey.
Building a Bulletproof Analytics Setup
Let’s be honest: your insights are only as good as the data you collect. If you want to accurately monitor conversion metrics, you need an analytics setup that’s both precise and comprehensive. Without this solid foundation, you’re just guessing which marketing efforts are actually moving the needle and which are burning through your budget.
This all starts with your analytics tool, which for most of us is Google Analytics 4 (GA4). A clean setup is non-negotiable. It ensures every action you care about is tracked correctly, giving you a clear, unpolluted stream of data to work with.
Defining and Configuring Conversion Events
First things first, you have to clearly define what a “conversion” actually means for your business within GA4. These aren’t the simple page-visit “goals” of the past; they’re now flexible events. This is a huge improvement, as you can now flag almost any tracked event as a conversion, whether it’s a simple newsletter sign-up or a complex, multi-step form submission.
For instance, tracking a button click is a common objective. But instead of just tracking clicks on all buttons, you can—and should—configure a specific event just for your “Request a Demo” button. This small change isolates your most valuable interactions from general site engagement, giving you a much cleaner and more meaningful conversion count.
Another critical piece is tracking form submissions. You can do this by tracking the submission event itself or by tracking visits to the “thank you” page that appears after someone successfully fills out the form. I’ve found that tracking the “thank you” page visit is often simpler to implement and less prone to tracking errors.
The whole point of this is to create a clear path for analysis: collect clean data, segment it by source, and then pinpoint exactly where people are getting stuck.
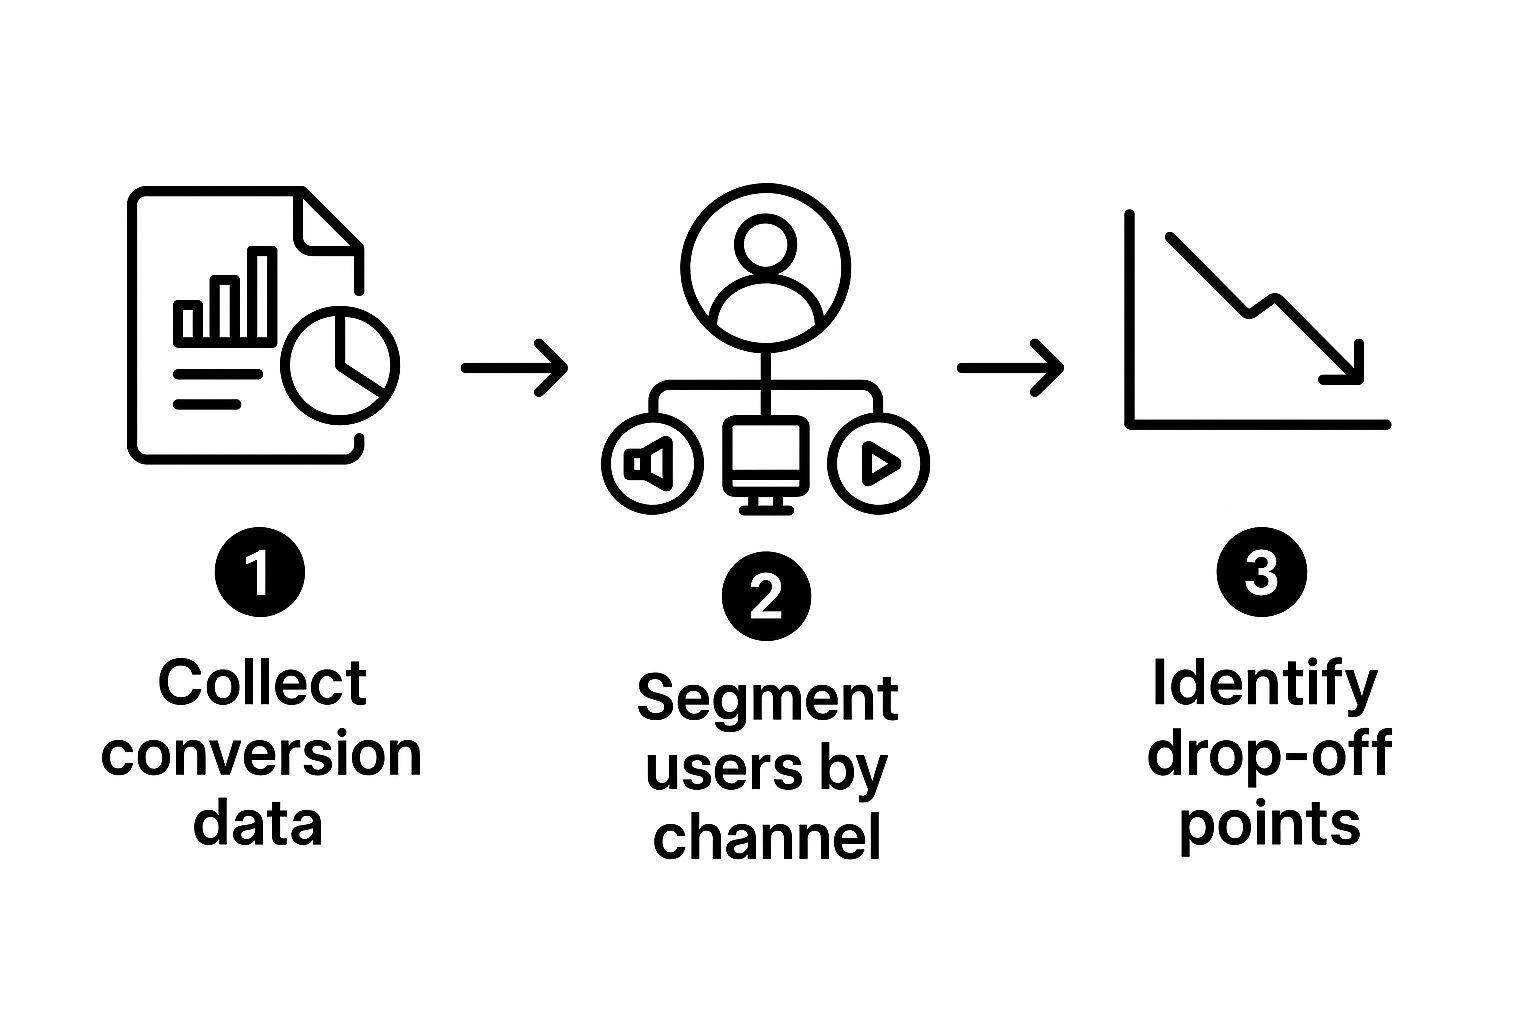
This visual really gets to the heart of the matter—turning raw numbers into a real strategy by spotting those critical drop-off points in the user’s journey.
The Power of Systematic UTM Tagging
Okay, so your events are configured. Now what? The next piece of the puzzle is understanding where your conversions are coming from. This is where Urchin Tracking Module (UTM) parameters become your best friend. A systematic, disciplined approach to UTM tagging isn’t just a nice-to-have; it’s essential for clear attribution.
UTM codes are simple tags you add to the end of your URLs. They tell your analytics tools exactly which campaign, source, and medium drove a particular visit. The real key here is a consistent naming convention to avoid messy, fragmented data that’s impossible to analyze.
Here are a few best practices I swear by:
- Always use lowercase. Google Analytics is case-sensitive, meaning
Facebookandfacebookwill show up as two different sources. Keep it simple and stick to lowercase. - Use hyphens, not spaces. A URL with
black-friday-saleis much cleaner and easier to read than one withblack%20friday%20sale. - Be ruthlessly consistent. Decide on a standard for your team—like
cpcfor all paid search andsocial-paidfor paid social media—and make sure everyone sticks to it.
One of the most common pitfalls I see is inconsistent UTM tagging. It creates an absolute nightmare in analytics reports, making it nearly impossible to accurately compare campaign performance. Do yourself a favor: create a simple spreadsheet for your team to use as a guide. It will save you hours of headaches down the line.
At the end of the day, effective UTM usage is a cornerstone of great marketing campaign tracking because it directly connects your marketing spend to actual results.
Integrating for a Complete Customer View
For the deepest, most valuable insights, you need to connect your analytics with other platforms, especially your Customer Relationship Management (CRM) system. This is where you bridge the gap between anonymous user behavior and real customer data.
By integrating your CRM, you can see not just that a conversion happened, but who converted and what their entire journey looked like, from their first touchpoint to becoming a paying customer. This closes the loop and gives you a powerful, end-to-end view of your marketing effectiveness.
Turning Raw Data Into Actionable Insights
Collecting data is just the beginning. The real magic happens when you learn to read the story your numbers are telling. To genuinely monitor conversion metrics, you have to push past the surface-level totals and get to the “why” behind what your users are doing. This is how you turn a pile of raw data into a clear roadmap for growth.
The most powerful way I’ve found to do this is through segmentation. Instead of fixating on your overall conversion rate, you need to break it down. By slicing your data into smaller, specific groups, you start to see the hidden patterns and find out who your most valuable audiences really are. Suddenly, a vague, general number becomes a sharp diagnostic tool.
Find Your High-Value Segments
Start by comparing conversion rates across different dimensions. This is the quickest way to shine a light on what’s working and what isn’t. Your goal here is to find those pockets of high performance you can double down on and, just as importantly, the areas of weakness that are bleeding money and need immediate attention.
Here are the essential segments I always start with:
- By Traffic Source: Compare how people from organic search, paid ads, social media, and email behave. Do visitors from your weekly newsletter convert way better than those clicking a specific Facebook ad? This tells you exactly where your marketing budget and effort will have the most impact.
- By Device Type: Look at the conversion differences between desktop, mobile, and tablet users. It’s common to discover that your mobile conversion rate is tanking compared to desktop, which is a huge red flag pointing to a clunky mobile experience that needs fixing.
- By Location: Segmenting by country, region, or even city can uncover surprising pockets of demand for what you offer. This can open up entirely new opportunities for targeted campaigns you would have otherwise missed.
A rookie mistake is treating all traffic the same. An insight like “our organic search traffic from Canada converts at 3x the site average” is infinitely more useful than just knowing your overall conversion rate is “2%.” Segmentation gives you the context you need to make smart, decisive moves.
This kind of breakdown is especially important when you consider how much a user’s context shapes their actions. For instance, industry research shows that while a typical commercial conversion benchmark is 1.4%, it changes dramatically by device. Desktop users tend to convert around 1.8%, but mobile devices often lag far behind at a mere 0.61%. Digging into this gap is critical for improving the experience on every platform. You can explore more of these conversion benchmarks on Klipfolio to see how you stack up.
Now, let’s look at how to apply this thinking to uncover specific opportunities.
Segmenting Data for Deeper Insights
By asking the right questions of your segmented data, you can move from simple observation to direct action. Here are a few examples to get you started.
| Segmentation Type | Example Question to Answer | Potential Action |
|---|---|---|
| New vs. Returning Visitors | Do first-time visitors abandon their carts more often than returning customers? | Create a pop-up offer for new visitors or send a follow-up email with a small discount to re-engage them. |
| Landing Page | Which landing page has the highest bounce rate but also attracts high-value traffic? | Revamp the page’s headline, call-to-action, or visuals to better match the ad that brought them there. A/B test a new design. |
| Demographics (Age/Gender) | Is a specific age group showing high engagement but low conversions? | Review your product messaging or pricing. It might not be resonating with that group’s needs or budget. |
| On-site Behavior | Are users who watch a product video more likely to convert? | Make videos more prominent on product pages or feature them in your email campaigns and social media ads. |
This table just scratches the surface. The more you slice and dice your data, the more of these hidden stories you’ll uncover.
Conduct a Conversion Funnel Analysis
Beyond segmentation, a conversion funnel analysis is your best friend for diagnosing friction points. This just means mapping out the exact steps a user has to take to convert—from hitting a landing page, to adding a product to their cart, navigating to the checkout page, and finally, making a purchase.
When you analyze this flow, you can pinpoint the exact stage where the biggest chunk of users is dropping off.
Let’s say you see that 90% of users who add a product to their cart successfully move on to the checkout page. But then, only 40% of those who start the checkout process actually complete it.
That massive drop-off is your signal. It’s screaming that there’s a major problem on your checkout page. Are you surprising them with high shipping costs? Is the form ridiculously long and complicated? Do you not offer enough payment options? The analysis doesn’t hand you the answer on a silver platter, but it tells you precisely where to start digging and helps you form a solid hypothesis you can A/B test. This is how you systematically turn insights into real, measurable improvements.
From Insights to Optimization That Actually Works
This is my favorite part of the process—where the rubber meets the road. After all the hard work of digging through data, segmenting your audience, and finding the real friction points, you’re finally armed with the insights you need. Now, we methodically turn that knowledge into tangible improvements through Conversion Rate Optimization (CRO).
It’s tempting to dive in and change a bunch of things you think will work. I’ve seen teams do this, and a scattered approach rarely gets results. The key is to be strategic and prioritize your efforts. A simple, yet incredibly effective, framework I always come back to is the Impact/Effort matrix. It helps you zero in on changes that deliver the biggest wins without burning through your team’s time and budget.
Think of it like sorting your ideas into four buckets:
- High Impact, Low Effort: These are your quick wins. Do these first. We’re talking about things like changing the text on a critical call-to-action button or clarifying a confusing headline.
- High Impact, High Effort: These are the big projects, like a complete checkout flow redesign. They have massive potential, but they need careful planning and significant resources.
- Low Impact, Low Effort: These are minor tweaks you can tackle when you have some downtime. Don’t expect them to move the needle much, but they can still be worthwhile.
- Low Impact, High Effort: Avoid these like the plague. They’re a surefire way to drain your resources with very little to show for it.
Designing Tests That Generate Clear Answers
Once your priorities are straight, it’s time to test your ideas. The gold standard here is A/B testing, also known as split testing. You create two versions of a page—the original “control” (Version A) and your new “variation” (Version B)—and show them to different groups of visitors to see which one performs better.
The most common mistake I see people make with A/B testing is changing too many things at once. If you change both the headline and the button color, you’ll have no idea which change actually caused the result. The secret is to change only one variable at a time.
For example, let’s say your funnel analysis points to the sign-up form as a major drop-off point. Your hypothesis might be: “I believe reducing the number of form fields from seven to four will increase submissions because it reduces friction for the user.”
Don’t just test for the sake of testing. Every experiment should start with a clear, data-backed hypothesis. Your analytics tell you what to test; your hypothesis explains why you believe a change will work. This is how you turn random guesses into a scientific process.
Proven Optimization Tactics to Test
While every business is unique, my experience has shown that a few common areas are almost always ripe for optimization. As you begin to monitor conversion metrics after a test, start by looking at these high-impact zones.
- Sharpen Your Value Proposition: Can a visitor understand what you do and why it matters within five seconds of landing on your page? Test different headlines and subheadings that speak directly to your customer’s biggest problems.
- Simplify Forms: Every single field you ask for adds friction. I’ve seen studies showing that reducing form fields can provide a massive lift in completions. Challenge every field—do you really need their phone number right now?
- Boost Page Speed: Slow-loading pages are an absolute conversion killer. If your page takes more than a few seconds to load, people will leave. Use tools like Google PageSpeed Insights to diagnose and fix what’s slowing you down.
- Enhance Calls-to-Action (CTAs): Don’t settle for “Submit.” Test different button colors, sizes, and especially the copy. Try changing “Submit” to something more benefit-driven, like “Get My Free Guide” or “Start My Trial.”
This continuous cycle of monitoring, analyzing, and optimizing is what truly separates high-growth companies from everyone else. It builds a culture of relentless improvement and is a fantastic way to improve your overall marketing ROI by making sure the traffic you worked so hard to get actually converts.
Answering Your Toughest Conversion Tracking Questions
Once you have your tracking in place, the real work begins. This is where the nuanced, tricky questions pop up—the ones that separate a basic setup from a truly insightful one. Let’s dig into some of the most common questions I hear from marketers and business owners who are getting serious about their data.
We’re moving past the “what” and into the “how” and “why” of great conversion tracking.
How Often Should I Actually Check My Metrics?
This is probably the most common question I get, and the honest answer is, “It depends.” The temptation is to check your analytics every day, but that’s a surefire way to drive yourself crazy over normal, everyday fluctuations. You’ll see one slow day and feel the urge to tear down a campaign that’s actually performing perfectly well over time.
What you need is a steady rhythm. Here’s what I recommend:
- Weekly Check-ins: This is perfect for a high-level pulse check. You’re looking for significant shifts in your main conversion rates, traffic sources, or key events. Think of it as scanning for big red flags or exciting new opportunities, not nitpicking daily numbers.
- Monthly Deep Dives: This is where the real strategy happens. Set aside time to go deep. Segment your audience data, analyze your funnel to see where people are dropping off, and compare this month’s performance to last month and the same month last year. These sessions inform big-picture strategy, not knee-jerk reactions.
The only time I break this rule is during a major campaign launch or when running a critical A/B test. In those scenarios, checking more frequently is smart just to make sure the technicals are working and to get an early read on performance.
What’s a “Good” Conversion Rate, Anyway?
Ah, the million-dollar question. The truth is, there’s no single magic number. A “good” conversion rate is completely dependent on your industry, your business model, and what you’re actually measuring.
An e-commerce brand might celebrate a 2% purchase conversion rate. On the other hand, a B2B SaaS company might be aiming for a 10% conversion rate on a demo request form. They’re both “good” in their own context.
Instead of getting fixated on an external number, you should be obsessed with your own. The most important goal is continuous improvement. If your lead magnet converted at 5% last quarter, your target for this quarter should be 6%. Your own past performance is the only benchmark that truly matters.
I see so many marketers get hung up on industry averages. They can give you a bit of context, sure, but they don’t know anything about your brand’s reputation, the quality of your traffic, or the strength of your offer. Your real competitor is who you were last month. If you can beat that, you’re winning.
How Do I Track Offline Conversions?
Connecting a real-world action—like a phone call or a store visit—back to a specific digital ad can feel like a huge headache, but it’s absolutely doable. The key is to build a bridge between your online and offline activities.
For example, a really effective tactic is using unique, trackable phone numbers for different campaigns. If you use one number on your Google Ads landing page and another on your Facebook ads, you’ll know exactly which channel is making the phone ring.
Another great method involves unique coupon codes. You could offer the code “PODCAST10” in a podcast ad and “FACEBOOK10” in a social media campaign. When a customer uses one of those codes in your physical store, you can attribute that sale directly back to its source. It just takes a little creativity, but closing this attribution loop gives you a far more accurate picture of what’s really driving your business forward.
Ready to stop guessing and start growing? The team at ReachLabs.ai specializes in building data-driven strategies that connect every marketing action to your bottom line. Let us show you how to get clear, actionable insights from your data.


