
So, what does it really mean to be data-driven? It’s a term that gets thrown around a lot, but it’s much more than a corporate buzzword. At its heart, being data-driven is a commitment to making decisions based on hard evidence and analysis, rather than just gut feelings or what’s always been done.
It’s about weaving data into the very fabric of your company culture, from the boardroom to the front lines.
What Does Being Data-Driven Actually Mean?
Let’s cut through the noise. Becoming data-driven isn’t just about owning a bunch of analytics tools or collecting massive amounts of information. It’s a complete shift in mindset.
Think of it this way: you have two sea captains. The first navigates by the stars and the feel of the wind—relying on years of experience and intuition. The second captain uses that same experience but also has advanced sonar, real-time weather maps, and GPS. Who do you think plots a safer, more efficient course? The second captain, of course, because they’re pairing their expertise with concrete data.
A truly data-driven organization doesn’t just react to problems; it uses information to get ahead of them and spot opportunities before the competition does. This approach empowers every single team to test their ideas, measure what’s working (and what’s not), and confidently make choices backed by evidence, not assumptions.
Ultimately, it’s not about getting lost in spreadsheets. It’s about asking smarter questions and using data to find the answers that move your business forward.
From Theory to Practice
So how does this philosophy play out in the real world? It completely changes how a company functions. Instead of managers making decisions from the top down based on what they think will work, teams are encouraged to form a hypothesis and then go find the data to prove or disprove it.
Let’s say a marketing team has a hunch that a new ad campaign will connect with a younger audience. The old way would be to launch it and cross their fingers. The data-driven way is much more methodical:
- A/B Test: They run small, controlled experiments with different ad creatives or messages to see which one actually performs better.
- Analyze Metrics: They keep a close eye on key numbers like click-through rates, conversions, and audience demographics as the data comes in.
- Iterate and Improve: Based on what the numbers tell them, they either double down on the winning version or pivot to a new strategy entirely.
This continuous loop of testing, measuring, and learning is the engine of a data-driven culture. It replaces guesswork with a clear, systematic process for improvement and ensures you’re putting your time and money where it will count the most.
A data-driven culture is one where data isn’t just a report that gets filed away. It’s a key participant in every strategic conversation—the “why” behind every “what” and “how.”
The Data Explosion Is Here
This shift is happening against a backdrop of unprecedented information growth. Thanks to things like real-time analytics, artificial intelligence, and the Internet of Things (IoT), the amount of data in the world is expanding at a dizzying pace.
How fast? By 2025, the total volume of data generated worldwide is expected to reach an astonishing 181 zettabytes. That’s 181 trillion gigabytes. You can dig into the numbers in the latest research on big data statistics.
This flood of information is both a massive challenge and an incredible opportunity. The companies that learn how to effectively harness this data will build a powerful competitive edge. Those that don’t risk becoming obsolete.
Building a Data-Driven Culture
Transitioning to a data-driven model requires more than just technology; it requires building a culture where data is valued, accessible, and used by everyone. This is often the hardest part, as it involves changing habits and established ways of thinking.
To make this shift successful, organizations need to focus on a few foundational pillars.
The table below outlines the key principles that form the bedrock of a truly data-driven organization.
Key Principles of a Data-Driven Culture
| Principle | Description | Business Impact |
|---|---|---|
| Data Accessibility | Making relevant data available to all employees, not just analysts or leadership. This requires the right tools and clear data governance. | Empowers teams to make informed decisions independently, speeding up action and fostering innovation at all levels. |
| Data Literacy | Training employees across all departments to read, understand, question, and work with data effectively. | Ensures that the data being collected is actually used to derive meaningful insights, increasing the ROI of data initiatives. |
| Leadership Buy-In | Senior leaders must champion the data-driven approach, lead by example, and invest in the necessary resources and training. | Sets the cultural tone for the entire organization, signaling that data-based decision-making is a core priority. |
| Psychological Safety | Creating an environment where employees feel safe to ask tough questions, challenge assumptions with data, and admit when an experiment fails. | Encourages honest inquiry and learning from failures, which is essential for genuine, data-led improvement and innovation. |
| Test-and-Learn Mindset | Fostering a culture of continuous experimentation, where ideas are treated as hypotheses to be tested, measured, and iterated upon. | Moves the organization from “we think” to “we know,” reducing risk and systematically optimizing business performance. |
Embracing these principles helps ensure that data becomes a shared asset that drives strategic conversations and fuels sustainable growth, rather than a siloed resource used by only a select few.
The Building Blocks of a Data-Driven Strategy
A truly data-driven approach doesn’t just materialize out of thin air. It has to be built, piece by piece, on a solid foundation. I like to think of it as a sophisticated supply chain, but instead of moving physical goods, you’re channeling information. Raw data is your starting material, and the finished product is a clear, actionable insight that fuels business growth. For this entire system to work, every single link in the chain has to be strong.
This process is all about turning messy, raw data points into genuine strategic assets. It kicks off with gathering information from every nook and cranny of your business and concludes with presenting that information in a way that anyone—from the C-suite to the front lines—can immediately understand and use. Every step is vital for ensuring the final insights are reliable, accurate, and ultimately, trustworthy.
Stage 1: Data Collection
First things first: Data Collection. This is where your entire journey starts, gathering the raw materials for your information supply chain. A smart data-driven strategy casts a wide net, pulling information from a huge variety of sources to build a complete, 360-degree view of your operations and customer interactions.
But effective collection isn’t just a numbers game; it’s about the quality and relevance of what you gather. The real goal is to capture clean, meaningful data from all the touchpoints where your business connects with customers or where internal processes happen.
Common sources usually include:
- Customer Relationship Management (CRM) Systems: This is your goldmine for customer interactions, purchase history, and sales pipeline activity.
- Web and Mobile Analytics: These tools track how people behave on your site and app—what they look at, how long they stay, and what paths they take to convert.
- Social Media Platforms: Here you can tap into audience sentiment, see who’s talking about your brand, and measure how people are engaging with your content.
- Transactional Systems: This captures hard data from sales, billing, and subscriptions, giving you a direct window into your revenue streams.
This first step is foundational. If you don’t have comprehensive and accurate data collection, the rest of the strategy simply can’t get off the ground.
Stage 2: Data Storage and Management
Once you have all that data, you need a safe, organized place to keep it. This is the Data Storage and Management stage, which I think of as the warehouse in our supply chain analogy. Just collecting data is pointless if you can’t store it in a way that makes it secure and easy to access for analysis later.
Most organizations rely on specialized systems for this. A data warehouse is a classic choice; it’s a highly structured repository that holds filtered, organized data perfect for business intelligence and reporting. On the other hand, a data lake is more like a vast, raw pool of data in its native format. It’s ideal for data scientists who need to dig into unstructured information without any predefined schemas. In reality, many businesses use a hybrid approach.
A well-managed data storage system is the difference between a tidy, searchable library and a chaotic pile of books. It ensures you can find the exact piece of information you need, right when you need it.
Effective management also hinges on data governance—the set of rules and procedures that maintain data quality, security, and compliance. This keeps your “warehouse” organized and ensures the information inside remains trustworthy.
The infographic below shows how data gets prepared for analysis.
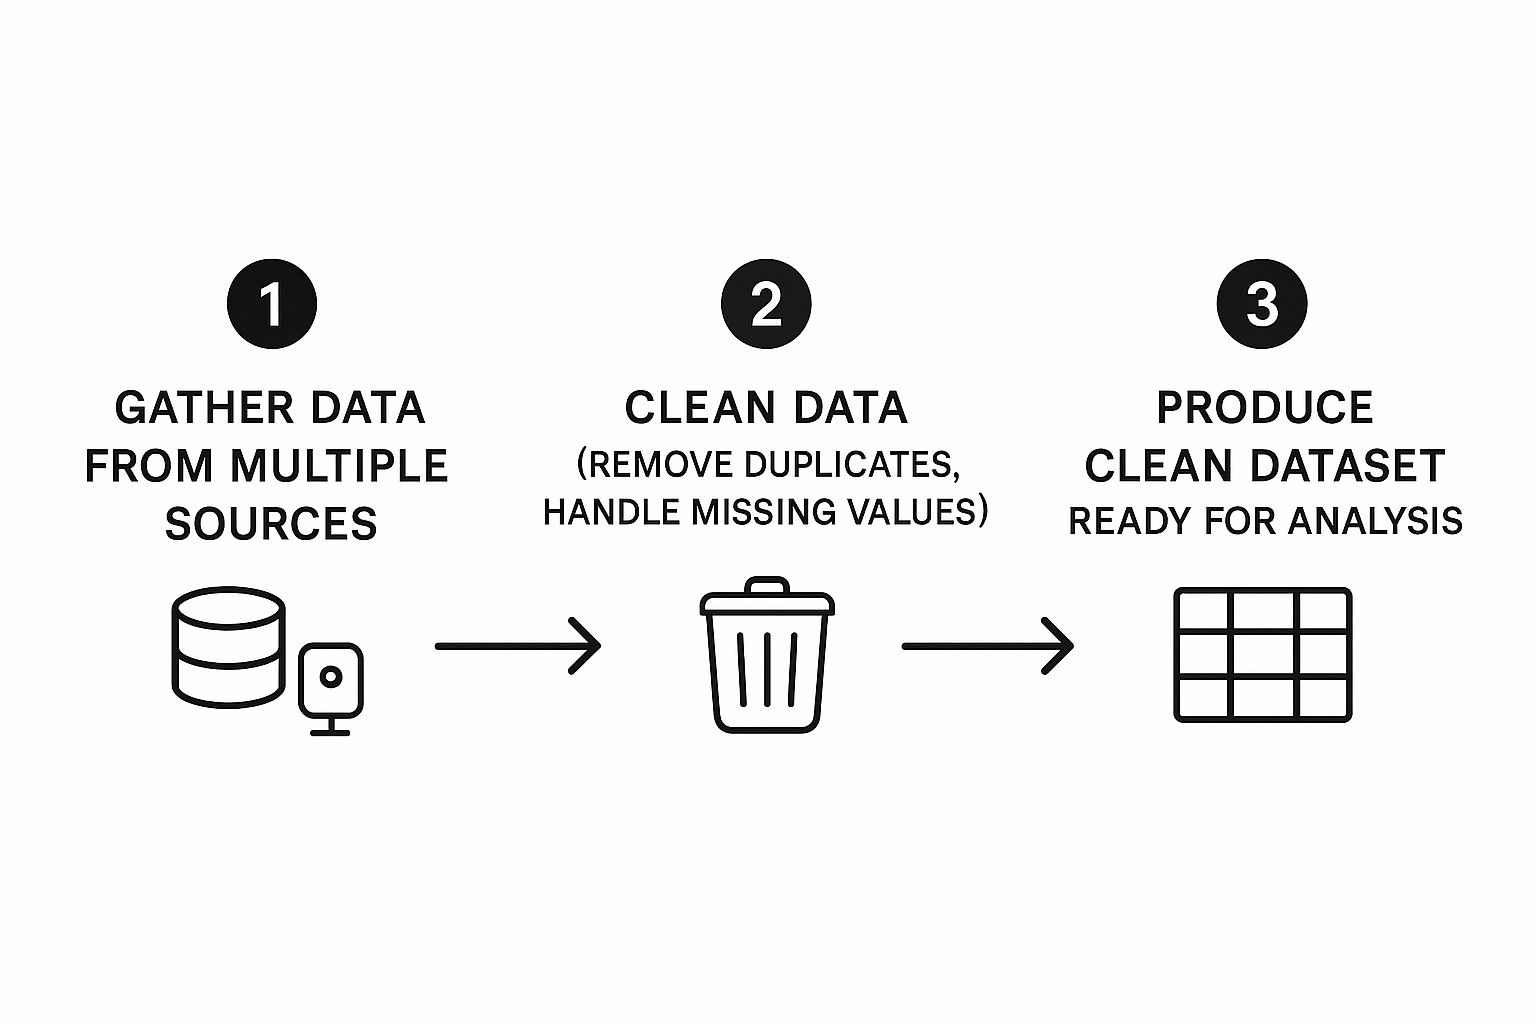
As you can see, data from many sources has to be gathered and then rigorously cleaned before you have a reliable dataset ready for the next stage.
Stage 3: Data Processing and Analysis
With your data collected and neatly stored, it’s time to make some magic happen. The Data Processing and Analysis stage is where raw numbers and disconnected facts get turned into meaningful patterns and insights. This is the manufacturing plant of our supply chain, where we convert raw materials into a genuinely valuable product.
“Processing” first involves a thorough cleaning—getting rid of duplicates, fixing errors, and figuring out what to do with missing values—to ensure everything is accurate. Once the data is clean, the real analysis begins. Analysts use statistical methods, machine learning algorithms, and other sophisticated techniques to spot trends, correlations, and anomalies that are completely invisible to the naked eye. This is a non-negotiable step in any serious data-driven marketing strategy, because it’s where you uncover the “why” behind what your customers are doing.
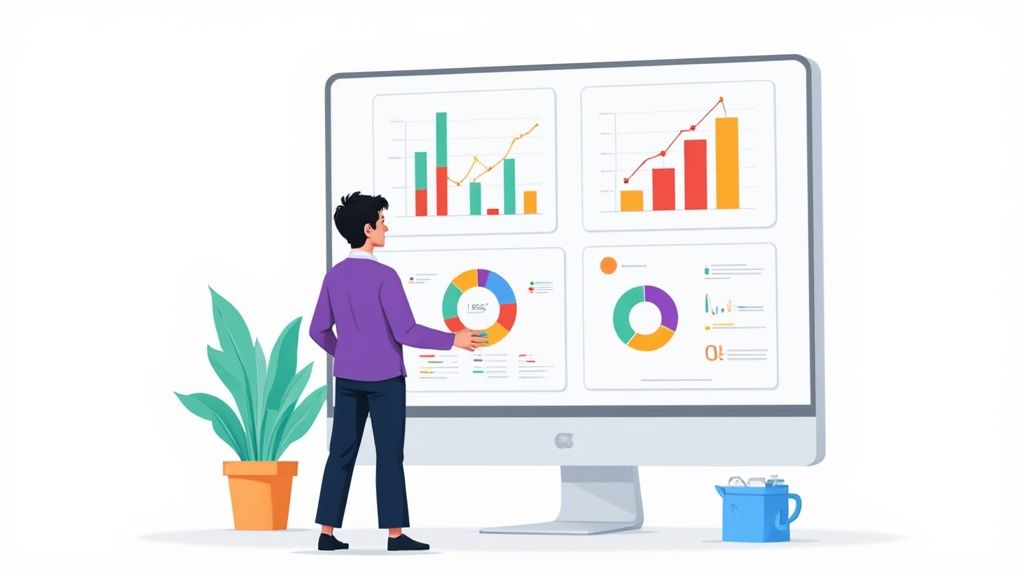
Stage 4: Data Visualization and Reporting
The final stage is Data Visualization and Reporting. After all, an insight is completely useless if the people who need to act on it can’t understand it. This stage is all about communication—translating complex analytical findings into clear, compelling stories that drive action.
This is usually done through tools like:
- Dashboards: Interactive displays that give you a real-time, at-a-glance view of your most important key performance indicators (KPIs).
- Reports: More detailed documents that summarize findings and offer specific recommendations to answer specific business questions.
- Charts and Graphs: These visual aids make trends and comparisons incredibly easy to grasp in an instant.
By presenting data visually, organizations empower leaders and their teams to make faster, more confident decisions. A single, well-designed chart can communicate an insight far more powerfully than a dense spreadsheet ever could, completing the journey from raw data to decisive action.
Proven Frameworks for Making Smarter Decisions
Having a solid data strategy is a great start, but theory alone won’t get you results. To really become a data-driven organization, you need structured frameworks that turn raw information into smart actions. These models give you a roadmap, taking the guesswork out of the equation and making your decisions systematic and repeatable.
Think of these frameworks like a chef’s recipe. A great chef doesn’t just throw ingredients in a pot; they follow a recipe to combine them into an amazing meal. In the same way, a business leader uses a framework to turn data points into a winning strategy. Without a clear process, you’re just guessing.
And this isn’t just for massive corporations. The 2025 Industry 4.0 Barometer shows just how critical this is on a global scale. While companies in the United States and China are leading the charge, with 91% and 78% treating data as a strategic asset, the DACH region is trailing at 64%. This gap highlights the urgency for businesses everywhere to adopt structured, data-informed methods. You can dig into the full findings on data-driven production here.
Let’s walk through three powerful frameworks that successful organizations use to make smarter, evidence-backed choices.
A/B Testing for Clearer Choices
One of the most direct and effective frameworks out there is A/B testing, sometimes called split testing. It’s essentially the scientific method applied to your business. Instead of sitting in a boardroom debating which headline will perform better, you let your audience give you the answer.
The process is surprisingly straightforward:
- Create Two Versions: Develop two variations of one specific element. This could be anything from a button on your webpage to an email subject line. Version A is your control (the original), and Version B is your new idea.
- Split Your Audience: Randomly divide your audience, showing Version A to one group and Version B to the other.
- Measure Performance: Track a key metric, like click-through rates or conversions, to see which version comes out on top.
- Implement the Winner: The version that shows a statistically significant improvement becomes your new standard.
The beauty of A/B testing is that it removes ego and office politics from the decision. You’re forced to rely on what people actually do, not what they say they’ll do, making it an essential tool for optimizing almost anything.
The OODA Loop for Agile Decisions
In markets that change by the minute, speed is everything. The OODA Loop is a framework built for making fast, effective decisions under pressure. It was originally created by military strategist John Boyd, but it’s a perfect fit for the fast-paced business world.
OODA is an acronym for:
- Observe: Collect raw data from your surroundings. What are your competitors up to? What are customers saying on social media? What are your analytics telling you?
- Orient: Make sense of that information to build a clear picture of what’s happening. This is the most important step, where you analyze context and identify your own biases.
- Decide: Based on your analysis, pick the best possible course of action.
- Act: Execute your decision. Now.
Once you act, the loop immediately starts over. This continuous cycle helps you adapt and react to market shifts far more quickly than competitors stuck in slow, linear decision-making processes.
The OODA Loop isn’t about making the perfect decision every single time. It’s about making a good enough decision right now, and then quickly iterating based on what you learn.
The Balanced Scorecard for Strategic Alignment
While A/B testing is tactical and the OODA Loop is operational, the Balanced Scorecard is all about strategy. It’s a management framework that helps organizations translate their big-picture vision into a concrete set of performance metrics.
Instead of focusing only on financial results, the Balanced Scorecard gives you a more complete view by measuring performance from four different perspectives:
- Financial: How are we performing for our shareholders? (e.g., revenue, profit margins)
- Customer: How do our customers perceive us? (e.g., satisfaction scores, customer loyalty)
- Internal Business Processes: What do we need to be the best at? (e.g., operational efficiency, product quality)
- Learning and Growth: How can we innovate and improve? (e.g., employee training, adopting new technology)
By connecting data from these four areas, you ensure your day-to-day work is directly tied to your long-term goals. It gets everyone in the organization aligned and pulling in the same direction.
How Top Industries Win with Data
It’s one thing to talk about data-driven frameworks in the abstract, but the real magic happens when you see them in action. This is where the theory hits the ground running. Let’s look at some real-world examples to see how different industries are using data to solve massive challenges and build a serious competitive edge.
These stories aren’t just about crunching numbers. They’re about completely reimagining how a business operates, creating unforgettable customer experiences, and in some cases, even saving lives. From the aisles of retail to the high-stakes world of finance and healthcare, data is the engine powering today’s most forward-thinking companies. Each example breaks down a specific problem, the data used to solve it, the methods applied, and the tangible results that prove just how powerful a data-driven mindset can be.
Retail Personalization at Scale
The retail world has practically perfected the art of using data to create personalized shopping experiences. They track everything from your browsing history and past purchases to the items you abandon in your cart. This isn’t just about showing you more ads; it’s about anticipating what you might need or want before you even know it yourself.
Think about your last visit to a major e-commerce site. The moment you start browsing for a new pair of running shoes, a whole ecosystem of algorithms springs into action.
- Problem: How do we get customers to buy more per visit and keep them coming back?
- Data Used: The platform collects data on every click, the time you spend on a product page, brands you’ve bought before, and even what other shoppers bought alongside those same shoes.
- Method Applied: Machine learning models use this information to build a surprisingly accurate profile of you as a shopper. This profile fuels a recommendation engine that suggests not just other shoes, but also high-performance socks, GPS watches, or running shorts that fit your style and budget.
- Measurable Outcome: The result is a clear lift in add-to-cart rates and average order value. More importantly, you feel like the store “gets” you, which builds loyalty and turns a one-time buyer into a repeat customer.
This kind of deep personalization is only possible when a business is truly data-driven. It transforms a simple transaction into a curated journey.
A data-driven retail strategy is like having a personal shopper for millions of customers at once. It anticipates needs, provides relevant suggestions, and builds a relationship that goes beyond just a single sale.
The financial implications of this shift are staggering. Between 2025 and 2037, the global Big Data and business analytics market is projected to skyrocket by about USD 1.51 trillion. The retail Big Data market alone is on track to hit $7.73 billion by 2025, while the banking sector’s analytics market is expected to reach USD 10.56 billion in the same year. You can explore these forecasts and learn more about big data’s growth trajectory.
Financial Fraud Detection in Milliseconds
In the fast-paced world of finance, every second and every decimal point counts. Banks and credit card companies are in a constant battle against increasingly sophisticated fraudsters. A data-driven approach isn’t just an advantage—it’s their most critical line of defense, letting them spot and shut down fraud in the blink of an eye.
Picture yourself making an online purchase. The instant you click “Confirm Order,” a complex data analysis process kicks into high gear behind the scenes.
- Problem: How can we block fraudulent transactions without inconveniencing legitimate customers?
- Data Used: The system instantly analyzes dozens of data points: the transaction amount, your physical location, the time of day, your typical spending patterns, and even the merchant’s risk profile.
- Method Applied: Powerful algorithms compare the new transaction against your established financial “fingerprint.” If the purchase is from an unusual country or for a much larger amount than you’d normally spend, the system flags it as a high-risk anomaly.
- Measurable Outcome: The system can automatically decline the charge and send you a text alert, all within seconds. This proactive defense saves both you and the bank from potential losses and builds a deep sense of trust and security.
Healthcare That Predicts the Future
Nowhere is the impact of data more profound than in healthcare. By analyzing enormous sets of patient records, clinical trial results, and public health statistics, organizations are shifting from simply treating sickness to proactively preventing it.
A fantastic example of this is in predicting disease outbreaks. Public health agencies can analyze aggregated and anonymized data to spot faint signals that warn of a coming health crisis.
- Problem: How can we identify and respond to a disease outbreak before it spirals out of control?
- Data Used: Analysts monitor everything from emergency room admission rates and pharmacy sales of flu remedies to keyword trends on social media where people mention symptoms.
- Method Applied: By connecting these seemingly unrelated data points, analytical models can detect an unusual spike in flu-like illnesses in a specific city, often days or weeks before traditional lab reports would confirm it.
- Measurable Outcome: This early warning gives public health officials a crucial head start. They can deploy resources, launch public awareness campaigns, and advise local hospitals to prepare for more patients. The result is a faster, more effective response that can dramatically reduce the spread of disease and ultimately save lives.
The examples above are just the tip of the iceberg. To get a broader sense of how this plays out across the economy, let’s compare how a few different sectors put data to work.
Data-Driven Applications Across Sectors
The table below gives a snapshot of how various industries are using data to tackle their unique challenges and drive incredible results.
| Industry | Primary Use Case | Key Data Sources | Achieved Outcome |
|---|---|---|---|
| Manufacturing | Predictive Maintenance | Sensor data from machinery, production logs, maintenance records. | Reduced equipment downtime by predicting failures before they happen. |
| Media & Entertainment | Content Recommendation | Viewing history, user ratings, time of day, device type. | Increased user engagement and subscription retention (e.g., Netflix, Spotify). |
| Transportation & Logistics | Route Optimization | GPS data, traffic patterns, weather forecasts, fuel consumption. | Lowered fuel costs, faster delivery times, and reduced carbon footprint. |
| Energy & Utilities | Smart Grid Management | Smart meter data, weather data, consumer usage patterns. | Balanced energy loads, prevented outages, and promoted efficiency. |
As you can see, the specific problems and data sources change from one industry to the next, but the core principle remains the same: using data to make smarter, faster, and more impactful decisions is the universal key to success.
The Tangible Benefits of a Data-Driven Culture
Shifting to a data-driven culture isn’t just about chasing a buzzword; it’s about unlocking real, measurable advantages for your business. When you commit to this approach, you move beyond gut feelings and start translating raw information into actions that directly boost your bottom line, sharpen your competitive edge, and prepare your business for whatever comes next.
The true magic happens when data empowers you to make smarter, faster, and more confident decisions in every department. Let’s break down the specific, real-world benefits you can expect when you put data at the very heart of your operations.
Dramatically Improve Operational Efficiency
One of the first things you’ll notice is how a data-driven mindset illuminates hidden problems. By tracking operational metrics—everything from supply chain timing to team productivity—you can pinpoint the exact bottlenecks that drain time and money.
Think about a manufacturing company that starts analyzing sensor data from its assembly line. The numbers might reveal that one specific machine consistently slows down on Tuesdays, causing a weekly production jam. With that insight, they can schedule preventative maintenance for Monday nights and solve a chronic issue that intuition alone could never have diagnosed. This same logic applies everywhere, from optimizing software development sprints to refining customer support workflows.
This focus on hard numbers turns vague operational headaches into specific, solvable problems, leading to serious cost savings and much smoother performance.
A data-driven approach transforms your operations from a series of educated guesses into a fine-tuned machine. It replaces “we think this is slow” with “we know this step costs us 12 hours a week,” allowing for precise and impactful improvements.
Deepen Customer Understanding and Personalization
In today’s crowded markets, truly understanding your customers is a game-changer. A data-driven strategy helps you move past broad demographic stereotypes and see your customers as individuals with unique behaviors, needs, and preferences.
By analyzing everything from purchase history and website clicks to how they interact with your marketing emails, you can build a rich, detailed picture of what your audience actually wants. This opens the door to powerful personalization that feels genuinely helpful, not creepy.
This deep understanding fuels all sorts of improvements:
- Tailored Product Recommendations: You can suggest items a customer is highly likely to buy based on their past actions.
- Customized Communication: Your marketing messages can speak directly to a user’s known interests or pain points.
- Proactive Customer Service: It’s possible to identify early warning signs of customer unhappiness and step in with support or a special offer before they leave.
This level of personalization doesn’t just drive sales; it builds powerful customer loyalty and increases lifetime value, turning one-time buyers into genuine fans of your brand.
Increase Profitability and Optimize Spending
Every business wants to get the most out of every dollar spent, and a data-driven approach gives you the map to get there. By analyzing financial and performance data together, you can make much smarter choices about where to put your resources for the biggest impact.
This is especially critical in marketing, where budgets can vanish quickly on campaigns that don’t deliver. With rigorous data analysis, you can see exactly which channels bring in quality leads and which are just noise. Companies that embrace this can confidently pull money from low-return activities and double down on what works, directly improving profitability. If you want to get more from your marketing spend, you can explore some great ways to improve marketing ROI with data-backed methods.
This thinking extends well beyond marketing. It can inform your pricing strategy, allowing you to test different price points to find that sweet spot between customer demand and maximum revenue.
Navigating the Common Challenges and Pitfalls
Let’s be realistic. Switching to a data-driven approach isn’t a flip of a switch; it’s a journey. And like any worthwhile journey, it has its share of bumps in the road. Knowing what these hurdles are ahead of time is half the battle. Too often, companies get swept up in the excitement of what data could do and completely underestimate the work it takes to get there.
One of the biggest traps is the age-old problem of “garbage in, garbage out.” The flashy reports and deep insights you’re aiming for are only as reliable as the raw data they’re built on. If your data collection is a mess, if information is stored inconsistently, or if you have huge gaps in your records, your analysis will be flawed. At best, it’s useless. At worst, it’s dangerously misleading. Getting your data quality in order isn’t just a step—it’s the foundation for everything else.
Beyond the tech, you’ll often run into a wall of cultural resistance. People who have built their careers on gut feelings and hard-won experience can see a data-first mindset as a threat. They might feel it devalues their expertise or overcomplicates things, which naturally leads to pushback and a painfully slow adoption rate.
The People and Process Problems
Building a truly data-driven organization is far more about people than it is about software. It demands a new way of thinking and a whole new set of skills. This brings us to a major challenge: finding the right talent.
You need people who are part data scientist, part business strategist, and part storyteller. It’s a rare combination. They have to be able to dig into the numbers, understand what they mean for the business, and then communicate those findings in a way that actually inspires action. This skills gap means companies either have to invest seriously in training their current teams or fight to hire from a very small pool of experts. It’s a fundamental part of the modern marketing decision making process.
Then there’s the massive technical headache of getting all your systems to talk to each other. Most businesses have their data locked away in different silos—customer info in a CRM, website traffic in an analytics tool, sales numbers in another platform. Trying to pull all of that into one unified view is incredibly complex, expensive, and takes a lot of time.
Data is never just about the data—it’s how we use and make sense of the data. How we interpret the data is subject to the same human biases and foibles that drive everything else we do.
This quote points to another, more subtle pitfall: confirmation bias. We’re all wired to look for evidence that proves what we already believe. A truly data-driven culture requires the guts to follow the numbers wherever they lead, even when they tell you a favorite strategy is a total flop. If you’re just cherry-picking stats to back up a decision you’ve already made, you aren’t being data-driven—you’re being “data-supported.”
Ethical and Privacy Considerations
Finally, the more data you collect, the more responsibility you have to protect it. We live in an era of strict privacy regulations like GDPR and CCPA, and navigating them is not optional. A data breach can lead to staggering fines, but the real damage is the complete erosion of customer trust, which can be impossible to win back.
To successfully sidestep these traps, you have to plan for them from the get-go. That means prioritizing:
- Data Governance: Create clear, non-negotiable rules for data quality, who can access it, and how it’s secured.
- Cultural Change Management: Don’t just announce the change; sell it. Constantly communicate the “why” and show teams how data makes their jobs easier and more impactful.
- Talent Development: Commit to ongoing training. Your goal should be to raise the data literacy of everyone in the company, not just a select few.
- Ethical Frameworks: Build strict guidelines for how data is used that always put the customer’s privacy first.
Frequently Asked Questions About Becoming Data-Driven
Even with a solid plan, taking the first steps toward becoming data-driven can feel a little daunting. Let’s tackle some of the most common questions that pop up for business leaders, so you can move forward with confidence.
What Is the First Step I Should Take?
Before you even think about data, think about a business problem. The single most important first step is to pick one specific, nagging question you want to answer.
Forget about boiling the ocean and collecting every piece of data imaginable. That’s a recipe for overwhelm. Instead, get focused. A vague goal like “improve sales” is useless. A sharp, targeted question like, “Which of our marketing channels delivers customers with the highest lifetime value?” gives you a clear starting point. This makes your first data-driven project manageable and directly links your efforts to a real business outcome.
How Much Does It Cost to Become Data-Driven?
This is a “how long is a piece of string?” question. The cost can range from next to nothing to millions of dollars. A small business can get started with powerful, low-cost tools like Google Analytics and a basic CRM. In contrast, a large enterprise might spend millions building a custom data warehouse and hiring a team of dedicated data scientists.
The trick is to let your investment grow with your needs and successes. Start small. Pick a high-impact project you can tackle with the tools you already have. Once you prove the value and see a tangible return, it becomes much easier to justify spending more on advanced tech and specialized talent. The goal is progress, not perfection right out of the gate.
Do I Need to Hire a Data Scientist?
Not right away, and maybe not ever. While data scientists are brilliant for complex predictive modeling, many of the foundational tasks of a data-driven organization can be handled by the people you already have.
Your first move should be to foster “data literacy” across your existing team. Train your people to read an analytics dashboard, understand what the key metrics actually mean, and feel comfortable asking tough questions based on the numbers. Creating a widespread culture where everyone uses data is far more powerful than siloing all that knowledge with one expert.
A data-driven culture isn’t built by one expert; it’s built when everyone feels empowered to use data to make better decisions in their own roles.
How Do We Handle Data Privacy and Ethics?
You need to treat data privacy as a non-negotiable from day one. It can’t be an afterthought. The best way to do this is to embrace a “privacy by design” mindset.
This simply means building privacy and security directly into your systems from the very beginning. Here’s what that looks like in practice:
- Anonymize Data: Strip out all personally identifiable information (PII) from your datasets whenever possible.
- Control Access: Implement role-based access so employees can only see the data they absolutely need to do their jobs. Nothing more.
- Stay Informed: Keep a close eye on regulations like GDPR and CCPA. Compliance isn’t optional.
Ultimately, being upfront and transparent with your customers about the data you collect and why you collect it is the bedrock of trust.
Ready to build a marketing strategy that’s truly driven by results? The experts at ReachLabs.ai combine world-class talent with powerful data insights to deliver creative solutions that move the needle. Stop guessing and start growing by visiting https://www.reachlabs.ai to see how.


