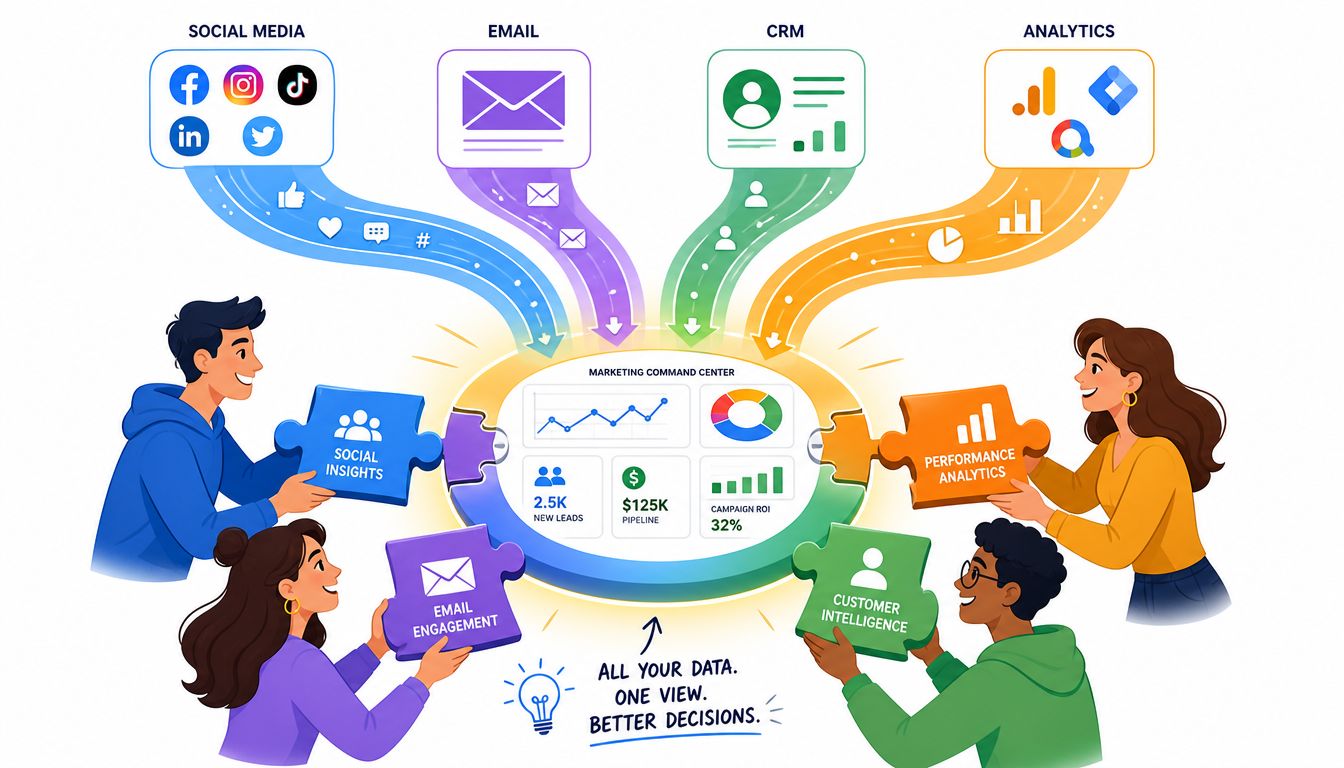
Monday starts with three tabs. By noon, it's thirty.
Google Ads says one thing. Meta says another. GA4 shows traffic trends that don't line up with CRM revenue. Your email platform reports engagement, but nobody can tie it cleanly to pipeline. A strategist exports CSVs, a manager patches formulas in a spreadsheet, and the weekly report still ends with the same argument: which number is the right one?
That's the operating reality for a lot of teams. Not because they lack tools, but because their tools don't speak the same language.
Marketing data integration fixes that. It turns isolated channel reports into a connected system that explains what happened, why it happened, and what to do next. Instead of asking five platforms for partial answers, you build one environment where spend, leads, opportunities, revenue, and customer behavior can be interpreted together.
If your reporting feels slower than your campaigns, you already know the cost. Teams spend energy reconciling data instead of using it. Decision-making drifts toward opinion because the evidence arrives late or arrives in conflict. Even strong dashboards fall apart without a reliable integration layer underneath them.
A lot of teams also discover that clean reporting alone isn't enough. They need a way to present insights clearly once the data is finally trustworthy. That's where strong data visualization for marketing becomes the difference between a warehouse full of numbers and a leadership team that can act.
From Data Chaos to Strategic Clarity
A common client situation looks like this: paid search sits in one dashboard, paid social in another, HubSpot or Salesforce in a third, and web analytics in a fourth. The team can answer channel questions in isolation, but the moment someone asks, “Which campaigns are driving qualified revenue?” the room gets quiet.
The problem usually isn't effort. It's fragmentation.
A paid media manager might optimize toward platform conversions. Sales looks at closed revenue. Finance wants validated spend. The CMO wants a cross-channel story that ties all of it together. When those views are disconnected, every meeting becomes a reconciliation exercise.
What changes when the system is unified
Marketing data integration changes the job from assembling reports to managing performance. It connects ad platforms, analytics tools, CRM records, and lifecycle systems so the team can evaluate outcomes from one shared model.
That matters because disconnected data creates false confidence. A channel can look efficient inside its own dashboard and still underperform once you connect it to lead quality or sales velocity. Integration exposes that gap early.
A dashboard isn't a source of truth if the inputs were never standardized.
The practical shift is simple to describe and harder to execute well. You stop treating each platform as a reporting destination and start treating every platform as a data source. Then you define common business logic across them.
The real strategic payoff
Once the data is connected, reporting becomes less political. Teams stop debating exports and start discussing trade-offs like these:
- Speed versus precision. Do you need near real-time monitoring for budget decisions, or do you need a slower but more validated executive report?
- Channel metrics versus business metrics. Should success be defined by platform conversions, CRM-qualified leads, or revenue contribution?
- Local optimization versus system optimization. Is each team chasing its own KPI, or is the organization optimizing toward shared commercial outcomes?
That's the move from chaos to clarity. Not prettier charts. Better decisions, made faster, with less internal friction.
Why Data Integration Is a Revenue Driver Not a Cost Center
Most integration projects get pitched the wrong way. They're framed as infrastructure upgrades, reporting cleanups, or analytics hygiene. Leadership hears “software cost” and “implementation time.” They don't hear business impact.
That's why many teams struggle to secure buy-in even when the operational pain is obvious. The bigger gap in the market isn't another explainer on connectors or ETL. It's the lack of a practical ROI model. As noted in Supermetrics' discussion of marketing data integration, organizations need to quantify the business value their integration strategy will bring, yet few resources give leaders a useful framework for doing that.
Start with the value pools
A strong business case usually comes from three value pools. You don't need invented benchmark numbers to use them. You need your own baseline.
Labor recovered from manual reporting
Track how many hours your team spends exporting, cleaning, mapping, and reconciling data each reporting cycle. Include marketing ops, analysts, channel managers, and leadership review time. Manual reporting doesn't just cost hours. It delays decisions and increases the odds of version-control errors.Faster campaign correction
When data arrives late, wasted spend lasts longer. If one campaign is overspending against low-quality leads, a unified system helps you catch it sooner because spend and downstream performance sit together. The financial impact comes from shortening the time between problem detection and budget action.Better targeting and personalization
Integrated data supports stronger segmentation because customer behavior, source, and CRM status can be interpreted together. Teams exploring that path often benefit from examples like Halo AI on customer data platforms, especially when the goal is turning unified profiles into activation rather than just reporting.
A simple ROI model executives understand
Use a working model with plain language:
| Value area | What to measure | Why leadership cares |
|---|---|---|
| Reporting efficiency | Current manual effort versus automated workflow | Lower operating drag |
| Optimization speed | Time from signal to decision | Less wasted budget |
| Commercial visibility | Ability to connect marketing inputs to revenue outcomes | Better planning and accountability |
| Personalization readiness | Whether audience logic can use unified customer data | Stronger lifecycle execution |
The point isn't to force precision where you don't have it. The point is to show that integration affects labor, budget allocation, and revenue visibility at the same time.
What works in the boardroom
Executives usually respond to three arguments better than a tool comparison:
- Risk reduction. If every monthly report requires manual intervention, key decisions depend on fragile processes.
- Decision speed. The faster a team can trust its numbers, the faster it can reallocate spend.
- Revenue confidence. Leadership wants to know whether reported performance translates into pipeline and revenue, not just whether a platform logged conversions.
A lot of teams also need a common language for how value gets attributed once data is integrated. If that conversation is fuzzy, finance and marketing will keep talking past each other. A clean primer on what revenue attribution means helps align that discussion before you choose tools.
Practical rule: Don't ask for budget to “centralize data.” Ask for budget to reduce reporting drag, improve budget decisions, and increase confidence in revenue attribution.
What doesn't work
Some justifications fail because they stay technical:
- “We need a modern stack.”
- “We want all data in one place.”
- “Our dashboards are messy.”
Those statements may be true, but they don't explain the commercial stakes.
A stronger version sounds like this: the current process forces paid media, lifecycle, and sales teams to work from different records of performance, which slows optimization and weakens accountability. That's a business problem, not a tooling preference.
Understanding Core Integration Architectures
The easiest way to understand architecture is to stop thinking about software and think about logistics.
Your marketing platforms are separate suppliers. Google Ads, Meta, LinkedIn, HubSpot, Salesforce, Shopify, and GA4 all produce raw materials in different formats. A data pipeline is the transport system that collects those materials, moves them to a central hub, and prepares them for use. NetSuite describes this clearly in its overview of marketing data integration and data pipelines. Data is extracted from source systems, moved into a central destination like a warehouse or lake, then standardized and modeled for analysis.

The stack in plain English
Here's the practical version of the stack:
- Source systems are the tools where data originates. Ad platforms, CRM systems, analytics tools, ecommerce systems, and email platforms.
- Pipelines move data out of those systems on a schedule or continuously.
- Warehouse or lake stores the data centrally.
- Transformation layer cleans names, standardizes fields, maps metrics, and builds reporting-ready tables.
- BI or activation layer turns structured data into dashboards, models, or audience syncs.
If one part breaks, the whole reporting chain becomes unreliable. That's why architecture decisions matter even if marketers never write a line of code.
ETL versus ELT
Often, jargon complicates matters. The distinction is simple.
| Approach | Sequence | Best fit |
|---|---|---|
| ETL | Extract, Transform, Load | When you need strict control before data enters storage |
| ELT | Extract, Load, Transform | When you want flexibility inside the warehouse after raw data lands |
ETL works like a sorting center that cleans every shipment before it enters the building. That can be useful when data quality rules are rigid or storage needs to stay tightly controlled.
ELT loads raw inputs first, then cleans and models them inside the warehouse. That gives analysts and engineers more flexibility because they can revisit transformations without re-pulling everything from the original source.
For many modern marketing environments, ELT is often easier to maintain because campaign naming changes, attribution logic evolves, and business questions shift. But there's no universal winner. The right choice depends on your team's skills, data volume, governance requirements, and tolerance for complexity.
Where tracking choices shape integration
Architecture isn't only about pipelines and warehouses. It also starts upstream with data collection. If browser-side tracking is inconsistent, your downstream model inherits those weaknesses. Teams that are rethinking collection methods often benefit from understanding server-side tracking, because it clarifies how cleaner event delivery can improve the quality of what enters the pipeline.
If your naming conventions are sloppy and your event design is inconsistent, no warehouse will magically fix the story later.
The operational question marketers should ask
A lot of clients focus on dashboards too early. The better question is: who owns the system that makes the dashboard possible?
That includes connector maintenance, schema changes, transformation logic, access permissions, and metric definitions. Those workflows often sit inside a broader marketing resource management discipline, because integration only works when people, process, and tooling stay coordinated.
When marketers understand the architecture at a basic level, vendor conversations improve fast. You can ask better questions, spot hidden maintenance costs, and avoid buying a reporting layer that's trying to compensate for a weak data foundation.
Your Step-by-Step Implementation Roadmap
Most marketing data integration projects fail for boring reasons. Nobody agreed on the business questions. The source systems were only partially inventoried. Definitions changed mid-build. The dashboard got designed before the data model did.
The fix isn't heroics. It's sequence.
A phased rollout keeps the project commercial, not just technical.

Phase one discovery and audit
Start by mapping the current environment in full. Not just paid media and CRM. Include every platform that creates or modifies customer, campaign, spend, or conversion data.
Key questions:
- Which systems are authoritative for spend, leads, pipeline, revenue, and customer records?
- Which reports matter most to leadership, channel teams, sales, and finance?
- Where does manual cleanup happen today and who does it?
- Which metrics are disputed every month?
This phase often reveals hidden dependencies. For example, a sales ops field may determine lead status, but marketing doesn't know the definition changed. Or finance may use a different spend source than the performance team.
Common pitfall: starting from available connectors instead of business requirements. Just because a tool can ingest a source doesn't mean that source should define your operating metric.
Phase two strategy and design
Once the audit is complete, design the model before you buy your way into complexity.
That means defining:
- Core metrics such as spend, leads, qualified leads, opportunities, revenue, customer status, and attribution logic
- Grain of analysis such as campaign, ad set, keyword, contact, account, or order
- Update cadence for each stakeholder group
- Ownership for taxonomy, transformations, and access controls
Teams decide how much standardization they're willing to enforce. If campaign naming is inconsistent across regions or business units, integration will expose that immediately.
Leadership note: A source inventory without metric definitions is just a software shopping list.
Phase three tool selection and setup
Now choose the stack that matches the operating model. If your team needs quick app-to-app connections, an iPaaS tool may be enough for some workflows. If you need historical storage, custom modeling, and complex joins across channels and CRM, you'll likely need a warehouse-centered setup.
During setup, prioritize a narrow but important use case first. A common pattern is one revenue-linked reporting flow, such as paid media to CRM to opportunity reporting. That gives the team a proving ground before broader expansion.
Before launch, review these practical checkpoints:
| Checkpoint | Why it matters |
|---|---|
| Connector coverage | Missing sources create blind spots from day one |
| Field mapping | Poor mapping creates false confidence in reports |
| Historical data handling | You'll need a plan for trend continuity |
| Access controls | Sensitive data shouldn't flow to every user by default |
| Error monitoring | Pipelines fail. You need to know when |
A lot of teams underestimate the need for validation. Don't trust a clean dashboard just because it loads.
Phase four execution and validation
Build the pipeline, but validate in layers.
Start with source-level reconciliation. Does spend in the warehouse match the platform within an acceptable tolerance for your use case? Then validate transformed logic. Are leads being classified correctly? Are revenue joins working as intended? Are date fields aligned across time zones and close dates?
The fastest way to lose internal trust is to launch a polished dashboard with unresolved logic issues.
Here's a useful implementation walkthrough to pair with your own planning:
Phase five optimization and governance
After rollout, the work becomes operational. Add sources gradually. Tighten definitions. Retire reports that duplicate the new system. Build a change process for any metric logic update.
The teams that get lasting value from marketing data integration treat it as a managed capability, not a one-time migration.
A practical ongoing cadence looks like this:
- Review pipeline health weekly.
- Audit metric definitions whenever campaign structures or CRM stages change.
- Validate business logic with end users, not just technical owners.
- Document exceptions so future reporting doesn't reinvent old confusion.
What works is discipline. What fails is assuming the system will stay correct without active stewardship.
Choosing the Right Marketing Integration Tools
Tool selection gets messy because buyers compare feature lists before they define the job the tool needs to do.
A spreadsheet connector, an iPaaS platform, a warehouse, a CDP, and a BI tool can all appear in the same buying conversation. They're not interchangeable. Each solves a different layer of the problem.
The market growth reflects how urgent this has become. The broader data integration market is projected at $15.18 billion in 2026 and $30.27 billion by 2030, with a 12.1% CAGR, while the iPaaS market is projected to grow from $12.87 billion in 2026 to $78.28 billion by 2032 at a 25.9% CAGR, according to Integrate.io's market analysis. That growth doesn't mean every category is right for every team. It means the pressure to connect fragmented systems is rising fast.

What each category is actually for
| Tool category | Primary role | Best for | Watch-out |
|---|---|---|---|
| iPaaS | Connect cloud apps and automate workflows | Operational integrations between systems | Can become messy for deep analytics use cases |
| ETL or ELT tools | Move and shape data for analysis | Warehouse-centered reporting and modeling | May require more technical oversight |
| CDP | Unify customer profiles for activation | Segmentation and personalization | Not a replacement for full analytics infrastructure |
| Warehouse or lake | Store centralized data | Long-term analysis and modeling | Storage alone doesn't solve metric logic |
| BI tool | Visualize and distribute insights | Dashboards and decision support | Garbage in, polished garbage out |
| Reverse ETL | Push modeled data back into business tools | Operationalizing insights in CRM and ad systems | Depends on clean upstream modeling |
Match the tool to the maturity of the team
A lean team with basic reporting needs may get value quickly from a lighter setup. A more complex organization usually needs clearer separation between ingestion, storage, transformation, and presentation.
A few buying criteria matter more than long feature lists:
- Connector fit. Does the tool connect reliably to your actual stack, not the stack shown in the sales demo?
- Scalability. Can it handle new channels, brands, markets, and business units without constant redesign?
- Ease of use. Who will maintain it after implementation?
- Security controls. Can you restrict access appropriately and support secure handling of customer data?
- Pricing logic. Does the pricing model stay sensible as data volume and source count increase?
If secure source connections are part of your selection process, a practical reference point is Connect your ad accounts securely, especially when evaluating how credentials and integrations get managed across multiple marketing platforms.
What usually leads to buyer's remorse
The most common mismatch is buying for the current report instead of the future operating model.
Examples:
- A team buys a dashboard-first tool when it really needs historical storage and transformation control.
- A team buys an enterprise-grade warehouse stack when it lacks the internal resources to maintain it.
- A team buys a CDP expecting it to solve finance-grade reporting.
- A team buys generic integration software and discovers it doesn't understand marketing-specific data quirks.
The best tool is the one that fits the questions you need answered, the skill set you have, and the maintenance load your team can sustain.
Governance KPIs and Future-Proofing Your Strategy
A clean implementation can still decay fast.
Fields change. CRM stages get renamed. New campaign types appear. Access expands informally. Six months later, the dashboard still loads, but nobody is fully sure what a “qualified lead” means anymore.
That's why governance matters. Not as bureaucracy, but as the operating system that keeps integrated data usable.

Build the governance layer early
A durable governance model usually includes four pieces:
Data ownership
Someone must own each major subject area. Spend data, CRM lifecycle stages, revenue fields, and customer identifiers can't all be “shared responsibility” forever.Access controls
NetSuite highlights role-based access controls and encryption in transit and at rest as important security practices in marketing data integration. That's not just an IT concern. It determines whether stakeholders trust the system enough to use it for decisions.Metric definitions
Build a data dictionary that explains every business-critical metric in plain English. Include logic, source fields, and exceptions.Change management
Every schema change, field rename, or taxonomy update should have an owner and a review path.
Governance isn't what slows reporting down. Unclear ownership does.
Use KPIs that measure the system, not just the campaigns
A lot of teams track marketing performance but never track the health of the integration that produces those reports.
Useful operational KPIs include:
| KPI | What it tells you |
|---|---|
| Time to insight | How long it takes from data generation to usable reporting |
| Data accuracy rate | Whether integrated outputs reconcile with trusted source records |
| Data completeness score | Whether required fields and records are consistently present |
| Data latency | How fresh the information is when users read it |
| Reporting efficiency | How much manual work still exists in recurring reporting |
These don't need performative complexity. They need ownership, review cadence, and thresholds your team acts on.
Prepare for AI-driven change
Many current guides fall short, explaining ETL basics but ignoring what happens when schemas start shifting more often because AI-driven tools and agent workflows create new data patterns.
Ninjacat identifies a major challenge here in its discussion of AI-oriented middleware and future-proofing data integration. The practical implication is straightforward: legacy pipelines built for static assumptions can break when APIs update, schemas drift, or agent-based systems introduce new metadata requirements.
That changes what “future-proof” means.
It now includes questions like:
- Can your pipeline tolerate schema changes without full manual intervention?
- Do you preserve raw data well enough to reprocess history when business logic changes?
- Can your team evaluate AI-generated fields before they enter core reporting?
- Who understands the orchestration layer if AI agents start touching campaign, CRM, or content workflows?
What resilient teams do differently
They don't chase every new tool. They design for adaptation.
That usually means:
- Separating raw storage from modeled outputs so reprocessing is possible.
- Documenting transformation logic so changes can be traced.
- Reviewing pipeline dependencies before adding new AI workflows.
- Training teams beyond classic analytics skills so data operations can work with newer orchestration patterns.
Operational advice: Future-proofing isn't predicting every change. It's building a system that fails gracefully, can be audited quickly, and can be updated without rebuilding from scratch.
When governance, measurement, and adaptability work together, marketing data integration becomes reliable enough to support both current reporting and whatever the next wave of platform changes brings.
Take Control of Your Marketing Narrative
Disconnected reporting doesn't just waste time. It weakens strategy.
When every platform tells its own version of performance, marketing loses the ability to explain cause and effect with confidence. Budget decisions slow down. Attribution turns political. Leadership sees activity, but not always clarity.
Marketing data integration changes that. It gives teams one operating model for performance, one framework for proving ROI, and one foundation for stronger forecasting, personalization, and optimization. The technical pieces matter, but only because they support better commercial decisions.
The strongest teams treat integration as a business system. They define value before they buy tools. They choose architecture based on operating needs, not vendor hype. They validate aggressively, govern consistently, and build with enough flexibility to absorb AI-driven changes instead of getting broken by them.
That's how you stop reacting to dashboards and start directing the story your data tells.
If your team is stuck between fragmented reporting and high-stakes growth decisions, ReachLabs.ai can help you turn scattered marketing data into a usable decision system. From strategy and reporting design to performance visibility and execution, they bring together the specialists needed to build clarity around what's working, what isn't, and where to invest next.