
Running ads without looking at the data is like trying to sell a house without ever holding a showing. It just doesn’t work. For real estate agents today, true success comes from digging deeper than surface-level numbers like views or impressions. The real key to turning your ad spend into actual, sign-on-the-dotted-line clients is providing comprehensive insights into advertising performance. It all starts with tracking your click-through rate (CTR)—not just as a number, but as a compass pointing you toward what buyers truly want.
Beyond Views: Why Ad Performance Insights Matter in Real Estate

In a market this crowded, simply “being online” isn’t a strategy. It’s just noise. Your advertising budget is a serious investment, and every single dollar needs to be pulling its weight to bring in high-quality leads that actually turn into commissions. This is where a data-first mindset really separates the top producers from everyone else.
When you shift from generic, “spray and pray” ad campaigns to precise, measured ones, you gain a massive advantage. The whole game changes. It’s all about understanding the key performance indicators (KPIs) that tell you what’s really happening behind the scenes. Instead of just getting excited about a high view count, the best agents are the ones who get in there and dissect the data to see how people are behaving, if the ad is relevant, and if the campaign is even efficient.
The Power of Click-Through Rate
Your Click-Through Rate (CTR) is one of the first and most honest metrics you’ll see. It’s simple: it’s the percentage of people who saw your ad and were interested enough to actually click on it. Think of it as a first impression. A high CTR is a great sign that your listing photos, headline, and targeting are all hitting the mark with the right audience.
On the flip side, a low CTR is your earliest warning that something is off. It might mean your property photos are bland, your ad copy is confusing, or you’re showing a luxury condo ad to first-time homebuyer prospects. When you treat CTR as a diagnostic tool, you can make smart, quick adjustments before you pour any more money down the drain.
Key Takeaway: Analyzing your CTR is the first real step in optimizing your ad budget. It lets you double down on campaigns that capture genuine interest and quickly cut the ones that aren’t connecting with potential buyers and sellers.
The good news? Real estate is one of those rare industries where people are actively looking for exactly what you’re selling. According to 2025 benchmarks, real estate ads on Google Search have an average CTR somewhere between 8.43% and 8.55%. That’s huge, especially when you compare it to the cross-industry average of just 3.17%. You’ve already got a head start. With that kind of built-in interest, your optimization efforts can produce incredible results if you know what you’re doing. You can learn more about what these numbers mean for your campaigns by reviewing recent advertising statistics.
To really get a handle on what’s working, you need to look at more than just one number. A few core metrics work together to give you the complete story.
Here’s a quick look at the essential metrics every agent should have on their dashboard. Think of these as the vital signs for your ad campaigns.
Essential Metrics for Real Estate Ad Campaigns
| Metric | What It Measures | Why It Matters for Agents |
|---|---|---|
| Click-Through Rate (CTR) | The percentage of people who click your ad after seeing it. | Instantly shows if your ad creative and targeting are compelling. |
| Cost Per Click (CPC) | The average amount you pay for a single click on your ad. | Helps you understand and manage your budget efficiency. |
| Conversion Rate | The percentage of clickers who complete a desired action (e.g., form fill). | Reveals if your landing page is effectively capturing leads. |
| Cost Per Acquisition (CPA) | The total ad spend divided by the number of new leads or clients. | Connects your marketing spend directly to real business results. |
By keeping a close eye on these KPIs, you move from guessing to knowing. You’ll have a clear, data-backed picture of which ads are bringing in the best leads for the lowest cost, allowing you to make smarter decisions that grow your business.
Building Your Campaign for Flawless Tracking
Great data doesn’t just appear out of thin air—you have to build the foundation for it. Before you can even start thinking about analyzing your metrics, you need a rock-solid setup to make sure every single click and conversion gets counted. Honestly, this initial legwork is the most important part of the whole process. Get it wrong, and your entire analysis will be built on shaky ground.
It all starts by getting the right tracking tools onto your website and landing pages. This usually means installing a small snippet of code, what folks in the industry call a tracking pixel, from ad platforms like Facebook or Google. This pixel is like your own private detective, watching how users behave and reporting back on what they do—which pages they view, if they fill out a form, or how long they stick around. You absolutely have to get this pixel placed correctly on your property listing pages and lead capture forms. It’s non-negotiable.
Mastering UTM Parameters for Clear Attribution
With your pixels in place, the next step is to get granular with UTM parameters. Don’t let the name intimidate you. They’re just simple tags you tack onto the end of your URLs to tell your analytics software exactly where a visitor came from. Think of them as custom signposts for your traffic.
Let’s say you’re running a campaign for a new luxury condo development. You’ve got ads running on Facebook, a featured listing on Zillow, and a banner ad on a local real estate blog. Without UTMs, all that traffic gets jumbled together in your reports. But with them, you can create a unique link for each source, like this:
- Facebook Ad:
yourwebsite.com/luxury-condo?utm_source=facebook&utm_medium=cpc&utm_campaign=luxury_condo_launch - Zillow Listing:
yourwebsite.com/luxury-condo?utm_source=zillow&utm_medium=referral&utm_campaign=luxury_condo_launch - Blog Banner:
yourwebsite.com/luxury-condo?utm_source=local_blog&utm_medium=banner&utm_campaign=luxury_condo_launch
This kind of careful tagging is what lets you give credit where it’s due for every lead and accurately track click-through rates from each specific channel. You’ll finally see which platform is driving the most engaged traffic, not just the most clicks. For a closer look at this, you might be interested in how to optimize campaigns in real-time with this level of detailed data.
This simple chart shows how all these pieces fit together.
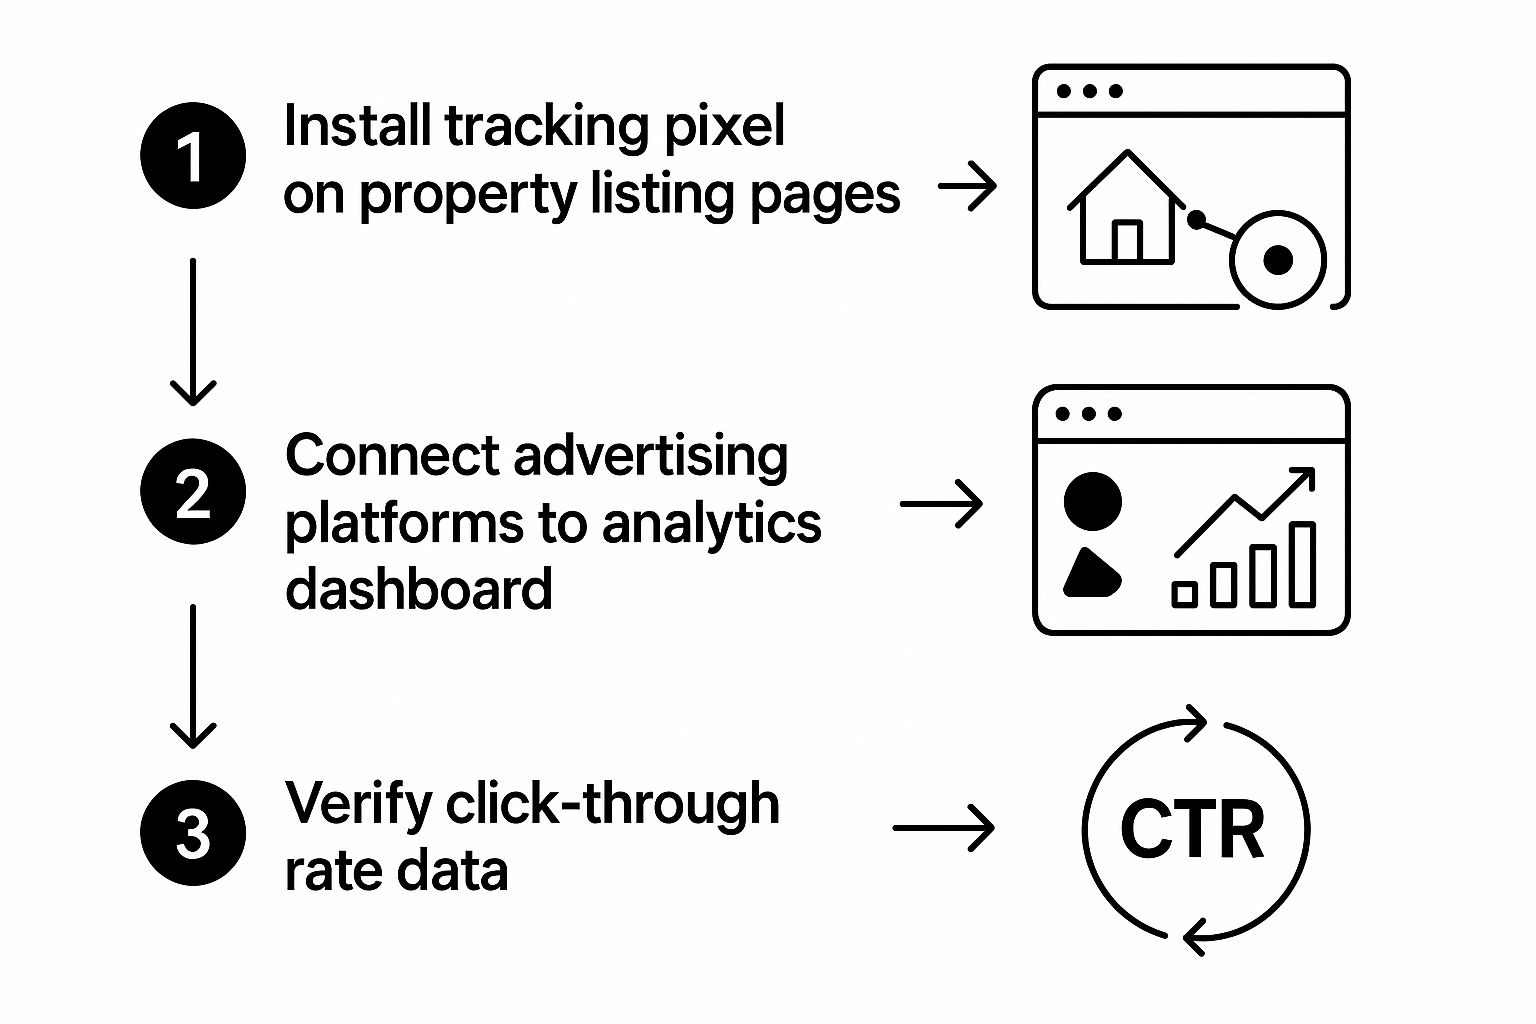
As you can see, success really hinges on connecting your website, ad platforms, and analytics into one seamless system.
Choosing Your Channels Wisely
It’s also critical to understand the cost and performance differences between platforms. For instance, Google Search ads in real estate average a $2.37 cost per click (CPC) but pull in a very healthy 3.71% CTR. On the flip side, Google Display ads are a lot cheaper at $0.75 per click but only manage a 1.08% CTR. This is a classic trade-off: you pay more for a click from someone with higher intent.
My Two Cents: Always, always test your tracking setup before you launch a campaign. Use free tools like Google’s Tag Assistant or the Facebook Pixel Helper to make sure your pixels are firing correctly. A tiny mistake here can make all your future data completely useless. I’ve seen it happen, and it’s a painful lesson to learn.
The final piece of this puzzle is making sure your analytics platform—like Google Analytics—is configured to actually receive and make sense of all this data you’re sending it. Setting up specific conversion goals, like a “Contact Us” form submission, is how you connect an ad click to a real, tangible business outcome.
Decoding Your Click-Through Rate to Refine Strategy

Alright, your tracking is set up and the data is rolling in. Now the real work starts. Having a pile of raw data is one thing, but knowing how to turn it into a winning strategy is what sets the top agents apart.
Your Click-Through Rate (CTR) is the very first piece of feedback you get from your audience. Think of it as the pulse of your campaign.
A high CTR tells you the message—your ad copy, your headline, your photo—is hitting the mark. A low CTR is an immediate red flag, signaling that you need to rethink your approach before you burn through your budget. Learning to read these initial signals is the foundation for getting comprehensive insights into your advertising performance.
Diagnosing Common CTR Scenarios
After running ads for a little while, you’ll start to see a few familiar patterns emerge. Figuring out what each one means is crucial for making smart, quick adjustments. Every scenario tells a story.
Here are a couple of the most common situations you’ll find yourself in:
- High CTR, Low Conversions: This is the classic “great ad, wrong destination” problem. People are intrigued enough by your ad to click, but the landing page isn’t sealing the deal. It’s a disconnect between the promise of your ad and the reality of the page.
- Low CTR, Low Impressions: This combo usually screams “targeting issue.” Your ad isn’t getting in front of enough of the right people. This could mean your audience is too narrow, or your bid is simply too low to compete in the ad auction.
That first scenario—a high CTR with hardly any leads—can be frustrating, but it’s also one of the most fixable problems. The good news? Your ad is doing its job perfectly. The breakdown is happening after the click, so you know to shift your focus to your website or landing page.
A high click-through rate is a vote of confidence from your audience that your ad is compelling. If those clicks don’t convert, it’s not the ad’s fault—it’s a clear sign you need to audit your landing page experience.
Turning Insights into Action Through A/B Testing
Once you have a hunch about what’s wrong, it’s time to test your theory. This is where you can track click-through rates not as a static number, but as a dynamic tool for getting better results. Your best friend in this process is A/B testing, also known as split testing.
It’s a straightforward concept: you create two versions of your ad, change just one thing between them, and show them to similar audiences to see which one performs better. The golden rule is to change only one variable at a time. If you swap out the headline and the main photo, you’ll have no idea which change actually made the difference.
Let’s walk through a real-world example. Say an agent is promoting a suburban family home and is seeing a disappointingly low CTR. The diagnosis is that the ad creative just isn’t connecting with the target audience.
Case Study: Testing Property Photos
- Ad A (The Control): Features a beautiful, wide-angle shot of the home’s exterior.
- Ad B (The Variation): Features a warm, inviting photo of the newly renovated, open-concept kitchen and family room.
After running both ads for a week, the agent finds that Ad B has a 45% higher CTR. This insight is gold. It shows that for this audience—probably families with kids—picturing their life inside the home is far more powerful than a shot of the curb appeal.
Armed with this data, the agent can now confidently lead with interior shots for similar properties in the future. If you want to get into the weeds of this, understanding how PPC provides advertisers with the ability to track and analyze campaign performance is key to proving your marketing spend is paying off.
Connecting Ad Clicks to Your Bottom Line
A click is just the first handshake. It’s an encouraging sign, sure, but it’s a long way from a signed contract. While it’s easy to get excited about a high click-through rate (CTR), that number is meaningless if those clicks don’t eventually lead to a commission check. The real goal is to draw a straight line from every dollar you spend on ads to the money you put in the bank.
This means you need to graduate from simply counting clicks to understanding their actual business impact. The focus has to shift to what happens after the click. Are the people from your high-CTR campaigns actually booking showings? Are they qualified buyers? This is where digging into your advertising performance becomes the key to sustainable growth.
Beyond Clicks to Conversions
To get the full picture, you have to track the metrics that tell the whole story. These are the numbers that truly measure business momentum and let you calculate your real return on investment (ROI).
I always tell agents to start tracking these two key performance indicators immediately:
- Lead-to-Showing Ratio: Of all the leads your ads generate, what percentage actually schedules a property tour? This metric is a fantastic filter; it quickly separates the window shoppers from the serious buyers.
- Cost Per Acquisition (CPA): Honestly, this is your most important number. It tells you exactly how much ad spend it took to land one new client. Calculating this means you have to follow a lead from that very first click all the way to a closed deal.
Tracking these metrics gives you a powerful lens to evaluate the quality of leads from different campaigns, which is a game-changer for making smarter budget decisions. You can learn more about how measuring ROI with data-driven transparency really pays off.
A Tale of Two Campaigns
Let me walk you through a common scenario I see all the time. An agent is running two campaigns for a new listing: one on Google Search and another on Facebook.
At first glance, the Google campaign seems to be crushing it. It has a fantastic CTR because it’s snagging people actively searching with high-intent keywords like “homes for sale in [city].” The Facebook campaign, meanwhile, has a much lower CTR. It’s reaching a wider audience that might just be scrolling, not actively looking to move.
But when you look past the surface-level vanity metrics, the story completely flips.
It turns out the Facebook leads, though fewer in number, are converting to showings at a much higher rate. The high-intent Google leads? A lot of them drop off before ever booking a tour. When you calculate the final Cost Per Acquisition, the “underperforming” Facebook campaign was actually the more profitable one.
This is exactly why you need the complete view. A sky-high CTR doesn’t always mean you’re getting high-quality leads.
This becomes even more critical when you look at industry trends. While the median click-through rate for real estate Google Ads hit an impressive 9.09% in 2024, the cost per lead also shot up by 20% to around $53.52, and conversion rates actually dipped. This data, which you can read more about in these 2024-2025 real estate benchmarks, shows it’s getting more expensive to turn those clicks into clients.
By tying your CTR and cost-per-click data to final sales numbers, you build a powerful framework for making smarter decisions, putting your budget where it works hardest, and driving real, profitable growth.
Advanced Tools for Deeper Performance Insights
The analytics inside your ad platform are a solid starting point. They tell you who clicked. But to really get ahead, you need to know what happens after the click. That’s where the real magic happens, and it requires a more sophisticated toolkit.
Moving past the basic metrics is what separates the pros from the amateurs. It’s about digging into the “why” behind your stats. Why did someone bounce from your landing page? Which photo in your property gallery made them pause? These are the questions that advanced tools help answer by illuminating the entire post-click journey.
Take a look at this example from the Hotjar platform. It uses a heatmap to visually show where people are clicking. Those bright red and yellow spots are the most popular elements on the page—they’re literally “hot.”
This kind of visual feedback is immediate and powerful. You can instantly see if visitors are engaging with your primary call-to-action or getting sidetracked by something else. This gives you a clear roadmap for what to fix.
Visualizing User Intent with Heatmaps
Platforms like Hotjar or Crazy Egg provide heatmaps, which are essentially a visual report card for your webpages. They show you exactly where users click, where they move their mouse, and how far down the page they scroll.
For a real estate agent, this is gold. A heatmap might show you that dozens of people are clicking on a beautiful photo of the community pool, even though it’s not a link. That’s a huge signal! It tells you to make that image an interactive element that leads to a gallery of community amenities.
This isn’t about guesswork. You’re making smart, data-driven decisions based on what your audience is actually doing. The result? Better conversion rates and a much healthier return on your ad spend.
Expert Tip: Don’t forget to check the scroll map feature. If you find that 80% of your visitors never scroll far enough to see your contact form, you know you have a problem. Move that form up!
Understanding the Full Journey with Session Recordings
Heatmaps give you the big picture by combining data from all your visitors. Session recording tools do the opposite: they let you watch anonymized recordings of individual user visits.
It’s like looking over a potential client’s shoulder as they navigate your site. You see every mouse movement, every click, and every frustrated jiggle when something doesn’t work right. This is one of the fastest ways to diagnose problems.
I once watched a session recording where a user on a mobile device tried to fill out a “Schedule a Tour” form three times. The keypad kept covering the “Submit” button, and they eventually gave up. That was a lead I would have lost forever, but seeing the recording gave me an immediate, actionable fix.
When you combine these qualitative insights with the quantitative data from Google Analytics 4, you get the complete story. You can track click-through rates from your ads and, more importantly, see what it takes to turn that click into a genuine lead.
Answering Your Top Ad Performance Questions
Once you start digging into your campaign analytics, you’re bound to have questions. Everyone does. Getting straight, practical answers is what separates a good campaign from a great one. Let’s tackle some of the most common questions I hear from real estate pros who are getting serious about tracking their click-through rates (CTR) and other metrics.
What’s a Good Click-Through Rate for Real Estate Ads?
This is the big one, isn’t it? The honest answer from someone who lives in this data is: it depends.
Sure, there are industry benchmarks. Some will tell you a search ad CTR around 8-9% is fantastic, and it is. But the most valuable benchmark is your own history. A “good” CTR is one that’s getting better over time.
Think of it like this: your real benchmark is what you achieved last month. If you were sitting at a 4% CTR and some A/B tests on your ad copy pushed you to 6%, that’s a huge win. That upward trend tells you you’re on the right track—your targeting is getting sharper, your images are catching more eyes, and your message is hitting home.
How Often Should I Be Checking My Ad Performance?
It’s so tempting to refresh your ad dashboard every few hours, I get it. But that’s a classic way to drive yourself crazy and make bad decisions based on normal daily blips. A single slow day doesn’t mean your entire campaign is broken.
Here’s a rhythm that has worked well for me and my clients:
- Weekly Check-ins: This is your sweet spot for spotting real trends. A week gives you enough data to smooth out the daily bumps and see what’s actually happening. You can identify what’s working and make small, smart adjustments.
- Monthly Deep Dives: This is where you zoom out and think strategically. Once a month, sit down and look at the big picture. How’s your budget allocation? Which ad creative was the clear winner? This is when you plan your major moves for the month ahead.
The goal is consistent monitoring, not constant tinkering. You have to give your campaigns enough runway to gather meaningful data before you make a big change. A disciplined approach keeps you from pulling the plug on a campaign that was just about to take off.
My CTR Is High, but I’m Not Getting Leads. What’s Wrong?
Ah, the classic “great clicks, no conversions” mystery. It’s incredibly common, and honestly, a bit frustrating. But there’s a silver lining here: a high CTR means your ad is a success. It’s grabbing attention and compelling people to click. The problem isn’t the ad; it’s almost always what happens after the click.
This disconnect usually points straight to your landing page. Your ad wrote a check that your landing page can’t cash. Take a hard look at that post-click experience.
Is the page’s value crystal clear the second it loads? Does it load fast, especially on a phone? And most importantly, is the call-to-action—like a “Schedule a Tour” button—obvious and simple? Your ad did its job perfectly; now it’s time to fix the destination.
Ready to stop guessing and start getting real results from your advertising? ReachLabs.ai integrates world-class talent with data-driven strategies to deliver marketing campaigns that move the needle. Let our team of specialists provide the comprehensive insights you need to turn clicks into clients. Explore our digital marketing solutions.


