
Marketing efforts must do more than generate buzz; they need to deliver tangible, measurable results. Relying on impressions and follower counts as primary indicators of success is no longer sufficient. Businesses now demand a clear return on investment (ROI) and a direct line from marketing activities to bottom-line growth. But how do you bridge the gap between action and outcome? The key lies in adopting structured frameworks that enforce clarity, accountability, and data-driven decision-making.
This article provides a comprehensive blueprint for doing exactly that. We will explore seven proven methodologies that empower marketers to move beyond vague goals and demonstrate concrete value. You will learn not just what to measure, but how to implement systems that ensure your campaigns are optimized for performance from the start.
Whether you’re a startup founder or a seasoned marketing executive, these frameworks will equip you with the tools to define, track, and achieve truly measurable results. By the end of this guide, you’ll have a practical toolkit for making every marketing dollar work harder and more effectively for your brand, proving its impact with undeniable data.
1. SMART Goals Framework
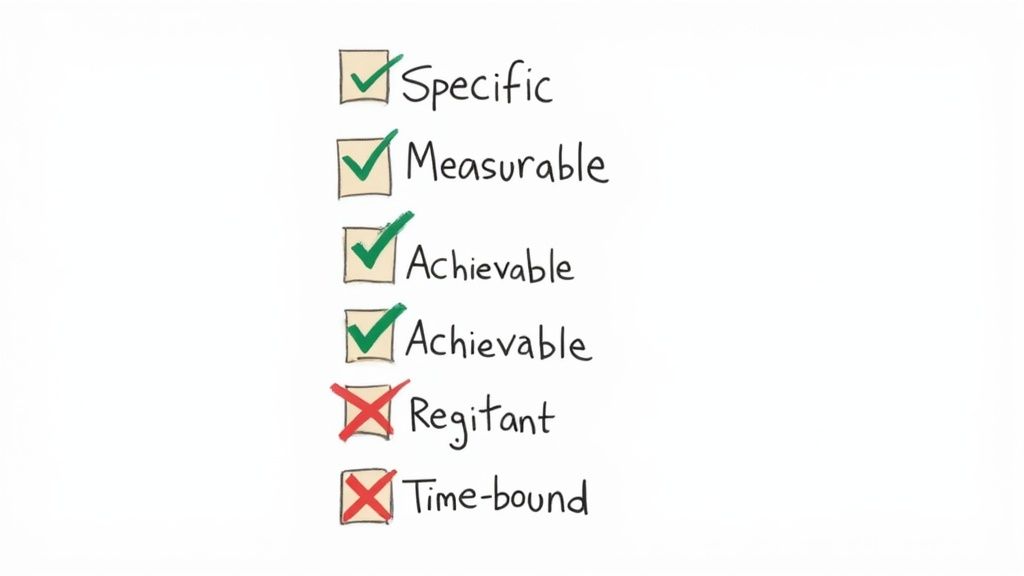
The foundation of any successful campaign aimed at achieving measurable results is a clear, well-defined objective. The SMART Goals framework is a powerful methodology for transforming vague aspirations into concrete, actionable targets. Originating from a 1981 article by George T. Doran, this acronym provides a simple yet effective checklist to ensure your goals have the structure needed for success. It forces you to move beyond “we want more traffic” to a plan with clear criteria and deadlines.
This framework ensures your objectives are Specific, Measurable, Achievable, Relevant, and Time-bound. Each component works together to create a goal that is both ambitious and grounded in reality, eliminating ambiguity and setting a clear path for your team. This structure is essential for tracking progress and ultimately demonstrating the value of your marketing efforts.
How to Apply the SMART Framework
Applying this framework requires a deliberate approach to goal setting. Instead of a generic goal like “improve social media,” a SMART goal would be: “Increase Instagram engagement rate from 2% to 4% by the end of Q3 by posting three video reels and five interactive stories per week.” This example is specific (Instagram engagement rate), measurable (from 2% to 4%), achievable (a realistic lift), relevant (supports broader social media strategy), and time-bound (by the end of Q3).
This level of detail is critical for achieving measurable results because it provides an unambiguous benchmark. Your team knows exactly what they are working toward, how their performance will be judged, and when it needs to be accomplished.
Actionable Tips for Implementation
To get the most out of the SMART framework, consider these practical tips:
- Break It Down: For large, ambitious goals (e.g., “Increase annual revenue by 20%”), break them down into smaller, quarterly or monthly SMART sub-goals. This makes the larger objective feel more manageable and allows for more frequent progress reviews.
- Document Everything: Write your SMART goals down and share them with all relevant stakeholders. This creates a sense of accountability and ensures everyone is aligned. Use a shared document or project management tool for visibility.
- Schedule Check-ins: Don’t just set goals and forget them. Schedule regular weekly or bi-weekly check-ins to review progress, identify obstacles, and make necessary adjustments. This agile approach keeps your strategy relevant and on track.
2. Key Performance Indicators (KPIs)
While SMART goals define your destination, Key Performance Indicators (KPIs) are the instruments on your dashboard telling you how you’re getting there. KPIs are the specific, quantifiable metrics that track your progress toward achieving a strategic objective. They are vital for generating measurable results because they distill complex business activities into a handful of critical data points, providing real-time insight into performance and enabling swift, data-driven decisions.
Popularized by experts like David Parmenter and the creators of the Balanced Scorecard, Robert Kaplan and David Norton, KPIs move performance measurement from abstract concepts to concrete numbers. This focus on the most critical success factors ensures that teams are concentrating their efforts on activities that truly drive the business forward, rather than getting lost in vanity metrics.

How to Apply KPIs Effectively
Applying KPIs means selecting metrics that directly reflect the success of your specific goals. For instance, if your SMART goal is to increase customer loyalty, your KPIs might include Customer Lifetime Value (CLV), Net Promoter Score (NPS), and customer churn rate. For a sales-focused goal, you might track Customer Acquisition Cost (CAC) and lead-to-conversion rate. The key is direct alignment; each KPI must answer the question, “How are we doing against our primary objective?”
This direct connection is what makes KPIs indispensable for achieving measurable results. A well-chosen set of KPIs provides a clear, objective, and ongoing narrative of your performance, allowing you to prove the value of your strategies with hard data. For more detail, you can learn more about how to measure marketing campaign success on reachlabs.ai.
Actionable Tips for Implementation
To implement KPIs effectively and avoid getting overwhelmed by data, follow these best practices:
- Maintain Laser Focus: Limit yourself to 5-7 core KPIs per major objective. This prevents “analysis paralysis” and ensures your team stays focused on the metrics that matter most.
- Align with Strategy: Ensure every KPI is directly tied to a high-level strategic business goal. If a metric doesn’t help you evaluate progress toward a core objective, it’s not a true KPI.
- Combine Indicator Types: Use a mix of leading indicators (predictive metrics, like website traffic or sales-qualified leads) and lagging indicators (outcome metrics, like total revenue or profit margin) for a complete picture of performance.
- Make Them Visible: Use dashboards and reporting tools to make KPIs visible and easily accessible to all relevant teams. This transparency fosters accountability and keeps everyone aligned and motivated.
3. Objectives and Key Results (OKRs)
While SMART goals provide a tactical foundation, the Objectives and Key Results (OKRs) framework offers a strategic approach to align your entire organization around ambitious goals. Popularized by Intel’s Andy Grove and later evangelized at Google by John Doerr, OKRs connect company, team, and personal objectives to specific, measurable outcomes. This system shifts focus from mere outputs (e.g., publishing 10 blog posts) to impactful outcomes (e.g., increasing organic leads from content by 15%).
The framework operates on a simple principle: the Objective is a qualitative, inspirational goal describing what you want to achieve, while the Key Results are quantitative metrics that measure your progress toward that objective. This structure fosters a culture of accountability and transparency, ensuring every team member understands how their work contributes to the bigger picture and drives measurable results.
This concept map illustrates how OKRs create a clear hierarchy, aligning individual efforts with overarching company goals.
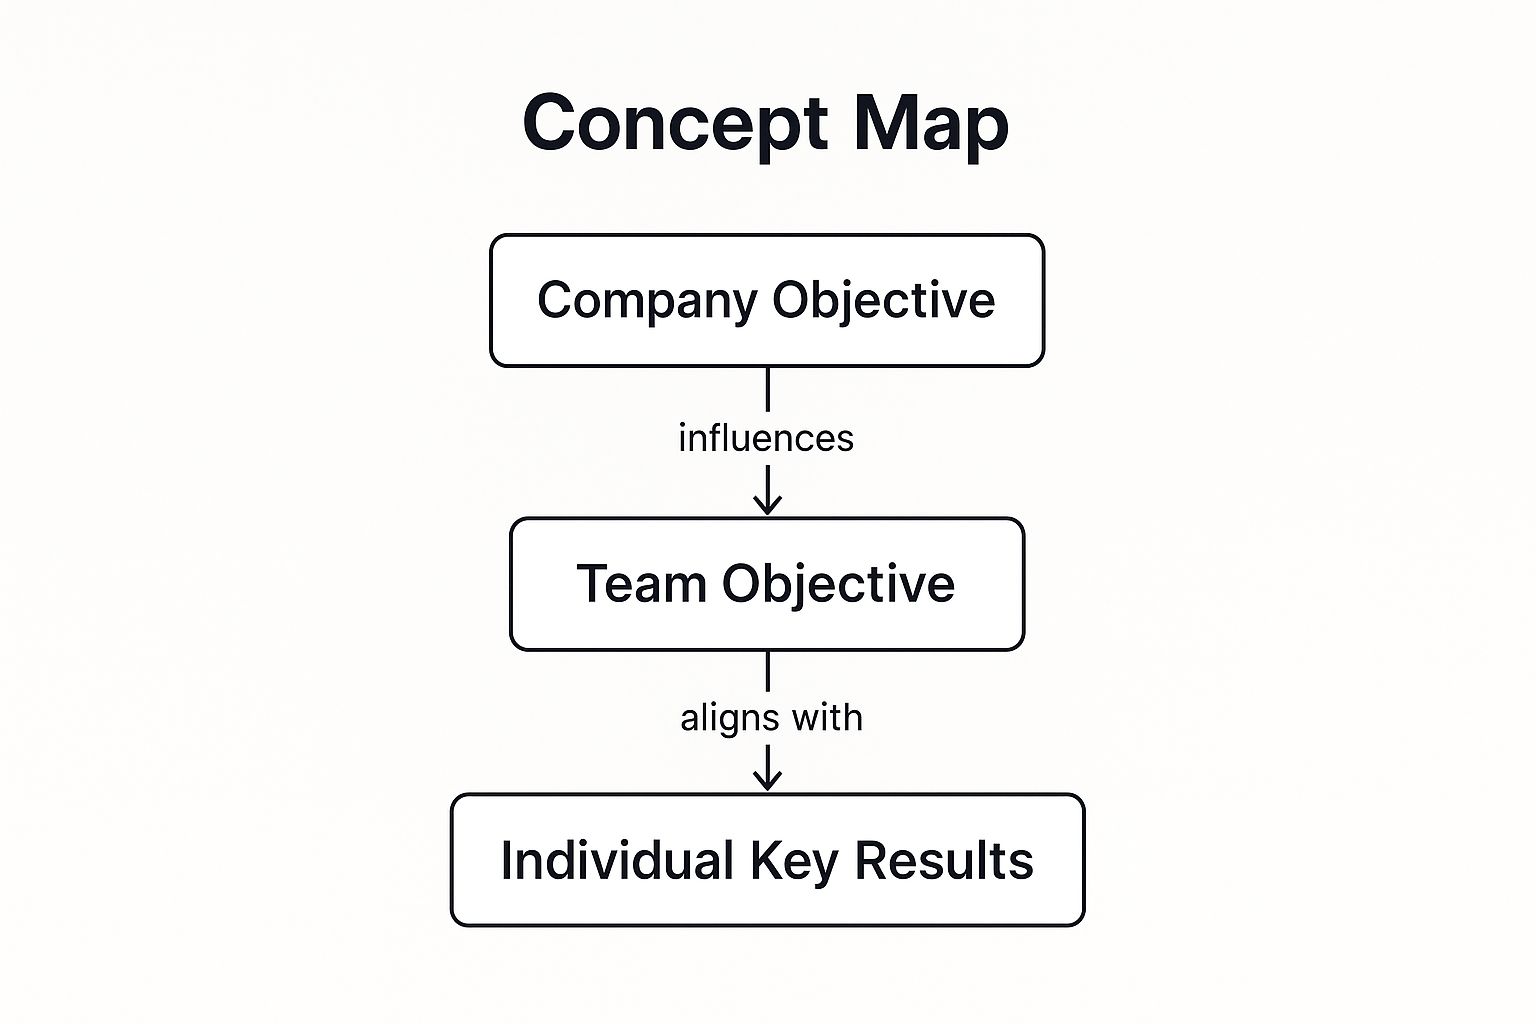
The visualization shows that a high-level Company Objective cascades down into focused Team Objectives, which are then broken down into specific Individual Key Results, ensuring top-to-bottom alignment.
How to Apply the OKR Framework
Applying OKRs effectively means setting ambitious goals that stretch your team’s capabilities. For example, a company might set an objective to “Become the recognized thought leader in our industry.” The marketing team’s corresponding key results could be: “Increase organic search traffic to our thought leadership content by 40% in Q4,” “Secure 5 guest post features in top-tier industry publications,” and “Grow LinkedIn followers by 25,000.”
This method forces teams to define success with clear, quantifiable metrics. It ensures that every activity is directly tied to achieving measurable results, preventing wasted effort on tasks that don’t move the needle. Companies like Google and LinkedIn have famously used this framework to achieve massive growth and market dominance.
Actionable Tips for Implementation
To successfully integrate OKRs into your workflow, consider these proven strategies:
- Limit Your Focus: Start with a maximum of 3-5 high-level objectives per cycle (typically quarterly). This prevents teams from becoming overwhelmed and ensures resources are concentrated on the most critical priorities.
- Embrace Stretch Goals: A key tenet of OKRs is to aim high. A 70-80% achievement rate on a key result is often considered a success, as it indicates the goal was challenging enough to push the team beyond its comfort zone.
- Ensure Transparency: Make OKRs visible to everyone in the organization using a shared platform or document. This transparency fosters cross-functional collaboration and reinforces a shared sense of purpose.
- Conduct Regular Check-ins: Schedule weekly or bi-weekly check-ins to track progress against key results. These meetings are crucial for identifying roadblocks, sharing learnings, and adjusting tactics as needed.
4. Balanced Scorecard
While granular metrics are vital, achieving truly measurable results requires a holistic view of performance. The Balanced Scorecard is a strategic management system that moves beyond purely financial indicators to provide a more comprehensive and balanced assessment of organizational health. Developed by Robert Kaplan and David Norton, it helps organizations translate their mission and strategy into a tangible set of performance measures.
This framework organizes metrics across four key perspectives: Financial, Customer, Internal Business Processes, and Learning and Growth. By connecting these areas, it creates a powerful narrative of how intangible assets like knowledge and customer relationships drive future financial outcomes. This approach ensures that short-term financial gains do not come at the expense of long-term strategic capabilities, offering a more sustainable path to success.
How to Apply the Balanced Scorecard
Applying the Balanced Scorecard involves creating a “strategy map” that links objectives across the four perspectives in a cause-and-effect chain. For example, improved employee training (Learning & Growth) can lead to more efficient internal processes (Internal Process). This, in turn, improves customer satisfaction (Customer), which ultimately drives revenue growth (Financial). Each objective is then assigned specific metrics and targets.
A classic example is Mobil Oil (now ExxonMobil), which used the Balanced Scorecard to transform its strategy from selling crude oil to providing exceptional customer experiences. By measuring customer loyalty and operational efficiency alongside financial returns, they successfully realigned the entire organization, leading to a dramatic improvement in profitability. This demonstrates how the framework connects high-level strategy to tangible, measurable results on the ground.
Actionable Tips for Implementation
To effectively implement a Balanced Scorecard, consider these essential practices:
- Start with Strategy: The scorecard is not just a collection of KPIs; it must be a direct reflection of your unique business strategy. Begin by clarifying your mission, vision, and strategic objectives before selecting any measures.
- Limit Your Measures: A common mistake is creating an overly complex scorecard. Aim for 20-25 measures in total across all four perspectives. This keeps the system focused, manageable, and easy for everyone to understand and act upon.
- Ensure Leadership Buy-In: The Balanced Scorecard is a top-down strategic tool. Success depends entirely on commitment and consistent communication from leadership. They must champion the process and use the scorecard to guide decision-making.
- Review and Adapt: Your strategy and business environment will evolve. Schedule regular quarterly or semi-annual reviews to assess performance, validate the cause-and-effect assumptions, and update measures as needed to keep the scorecard relevant.
5. A/B Testing and Experimentation
The pursuit of measurable results is fundamentally a scientific process, and no method embodies this better than A/B testing. Also known as split testing, this is a systematic approach for comparing two versions of a webpage, email, or other marketing asset to see which one performs better. By isolating variables and measuring actual user behavior, A/B testing empowers organizations to move beyond intuition and make data-driven decisions that directly impact key metrics.
This methodology is crucial because it takes the guesswork out of optimization. Instead of debating whether a blue or green “Buy Now” button is more effective, you can test both simultaneously with live traffic and let the data declare the winner. This process of continuous experimentation, pioneered by figures like Ronald Fisher and popularized by tech giants like Google and Amazon, is the engine behind some of the most successful digital products and campaigns today.

How to Apply A/B Testing
Applying A/B testing begins with a clear hypothesis. For instance, you might hypothesize: “Changing the headline on our landing page from ‘Advanced Software Solutions’ to ‘Grow Your Business by 20% in 90 Days’ will increase form submissions because the new version highlights a specific benefit.” You then create two versions of the page: Version A (the control) with the original headline, and Version B (the variation) with the new one. Traffic is split between them, and you measure which version generates more conversions.
This disciplined approach provides undeniable proof of what works for your audience. Companies like Netflix constantly test everything from promotional artwork to recommendation algorithms, using the results to fine-tune the user experience. By adopting a similar mindset, you can achieve measurable results in areas like lead generation, sales, and user engagement. To dive deeper into this topic, explore these expert conversion optimization tips.
Actionable Tips for Implementation
To ensure your experiments yield trustworthy and valuable insights, follow these best practices:
- Test One Variable at a Time: To know what caused a change in performance, isolate a single element. If you change the headline, call-to-action button, and image all at once, you won’t know which change was responsible for the outcome.
- Ensure Statistical Significance: Don’t end a test prematurely. Run it long enough to collect sufficient data for a statistically significant result, which confirms the outcome isn’t due to random chance. Most testing platforms will calculate this for you.
- Document and Share Learnings: Create a central repository or document where all test results, both wins and losses, are recorded. Sharing these insights across the organization prevents teams from repeating failed experiments and builds a collective intelligence about what resonates with your audience.
6. Six Sigma and DMAIC Methodology
For organizations committed to achieving operational excellence, Six Sigma offers a rigorous, data-driven approach to process improvement. Originating at Motorola in 1986 and famously championed by Jack Welch at General Electric, this methodology focuses on minimizing process variation to reduce defects. The ultimate goal is to achieve near-perfect quality, limiting defects to just 3.4 per million opportunities, a standard that guarantees highly predictable and measurable results.
At the core of Six Sigma is the DMAIC framework, a five-phase cycle for optimizing and stabilizing business processes. This acronym stands for Define, Measure, Analyze, Improve, and Control. By systematically progressing through these stages, teams can identify the root causes of problems, implement effective solutions, and ensure that improvements are sustained over time, making it a powerful tool for any department, including marketing.
How to Apply the DMAIC Framework
Applying DMAIC requires a structured project management approach. For example, a marketing team noticing a high unsubscribe rate from its email newsletter could use the framework. They would Define the problem (e.g., “Reduce email unsubscribe rate from 4% to under 1%”). Then, they would Measure current performance data, segmenting by email type, send time, and audience.
Next, they would Analyze the data to identify root causes, such as poor subject lines or irrelevant content for certain segments. In the Improve phase, they would test solutions like A/B testing subject lines and personalizing content. Finally, in the Control phase, they would implement the successful changes as standard procedure and monitor the unsubscribe rate to ensure it stays low. This disciplined process ensures that every action is tied directly to achieving measurable results.
Actionable Tips for Implementation
To successfully implement Six Sigma principles, consider these practical tips:
- Start with a Clear Project Charter: Before beginning, define the project scope, objectives, stakeholders, and timeline in a formal charter. This document ensures everyone is aligned and prevents scope creep.
- Secure Leadership Buy-in: Six Sigma projects often require cross-functional collaboration and resources. Ensure you have strong support from leadership to remove roadblocks and champion the initiative.
- Use the Right Statistical Tools: The Analyze phase is data-intensive. Utilize appropriate statistical tools like root cause analysis (e.g., fishbone diagrams) and regression analysis to make informed, evidence-based decisions rather than relying on intuition.
- Establish Robust Control Measures: The ‘C’ in DMAIC is critical. Create process documentation, dashboards, and regular review meetings to monitor the improved process and prevent it from reverting to old habits.
7. Lean Analytics and Metrics-Driven Development
Achieving measurable results in a startup or a new product launch requires a focused, agile approach to data. Lean Analytics provides this by concentrating on finding the right metric to track at the right time. Popularized by authors Alistair Croll and Benjamin Yoskovitz, this methodology champions the idea of the “One Metric That Matters” (OMTM), which helps teams avoid getting lost in vanity metrics and instead focus on data that drives genuine business growth.
This framework is built on the principle of validated learning, where every action is an experiment designed to answer a critical business question. Rather than building a full-featured product based on assumptions, teams use data to find product-market fit efficiently. This intense focus on a single, crucial metric at each stage ensures that all efforts are aligned with what truly moves the needle, making progress tangible and directly tied to business objectives.
How to Apply Lean Analytics
Applying Lean Analytics means identifying your current business stage (e.g., Empathy, Stickiness, Virality, Revenue, Scale) and selecting the one metric that best defines success for that stage. For instance, a new app in the “Stickiness” stage might ignore new user sign-ups (a vanity metric at this point) and focus solely on daily active users (DAU) or customer retention rate as its OMTM. This singular focus helps prioritize features and marketing campaigns that directly impact user engagement and loyalty.
This disciplined approach is critical for generating measurable results because it eliminates noise and distraction. When the entire team, from developers to marketers, is optimizing for a single, clearly defined metric, decision-making becomes faster and more effective. For example, Dropbox famously focused on viral coefficient as its OMTM, leading to its highly successful referral program that rewarded users for inviting friends.
Actionable Tips for Implementation
To effectively implement a metrics-driven development culture, consider these practical tips:
- Identify Your Stage and OMTM: Honestly assess your business stage. Are you still trying to solve a problem (Empathy) or are you ready to grow your user base (Virality)? Choose one primary metric that reflects success for that specific stage and rally your team around it.
- Establish a Data-Driven Cadence: Set up regular, data-focused meetings (daily or weekly) to review your OMTM. Discuss what experiments were run, what was learned, and what adjustments are needed for the next cycle. This keeps the team agile and responsive.
- Balance Leading and Lagging Indicators: While your OMTM might be a lagging indicator (like revenue), track related leading indicators (like demo sign-ups or trial-to-paid conversion rates) to get an early signal of future performance. This proactive approach is a cornerstone of effective marketing workflow management.
Measurable Results: 7-Method Comparison
| Framework / Methodology | Implementation Complexity 🔄 | Resource Requirements ⚡ | Expected Outcomes 📊 | Ideal Use Cases 💡 | Key Advantages ⭐ |
|---|---|---|---|---|---|
| SMART Goals Framework | Moderate: Requires careful goal formulation and tracking | Low to Moderate: Mainly planning tools and time | Clear, measurable goals with deadlines | Personal and organizational goal setting | Eliminates ambiguity; scalable; clear success metrics |
| Key Performance Indicators (KPIs) | Moderate to High: Needs data infrastructure and regular review | High: Data gathering and monitoring systems | Objective performance measurement and accountability | Performance tracking, strategic monitoring | Real-time insights; data-driven decisions; benchmarking |
| Objectives and Key Results (OKRs) | High: Cultural shifts and regular updates needed | Moderate to High: Management time and communication | Organizational alignment; ambitious stretch goals | Companies seeking alignment and ambitious growth | Transparency; encourages ambition; outcome-focused |
| Balanced Scorecard | High: Complex strategy mapping and dashboard setup | High: Cross-functional input and data integration | Holistic performance view across multiple dimensions | Strategic planning and balanced organizational performance | Links strategy to operations; cause-effect insights |
| A/B Testing and Experimentation | High: Requires experimental design and technical setup | High: Traffic/sample size and testing tools | Data-driven decisions with measurable impact | Product optimization, UX/UI improvements | Objective insights; reduces risk; continuous improvement |
| Six Sigma and DMAIC Methodology | Very High: Structured, intensive training and project focus | Very High: Skilled personnel, training, and tools | Defect reduction and process improvement | Manufacturing, quality control, complex processes | Data-driven; strong problem solving; cost savings |
| Lean Analytics and Metrics-Driven Development | Moderate to High: Focus on one metric and rapid iteration | Moderate: Analytics tools and team discipline | Rapid validated learning and product-market fit | Startups and iterative product development | Prevents vanity metrics; accelerates learning; focus |
From Data to Decisions: Implementing Your Measurement Strategy
Navigating the landscape of modern marketing requires more than just creativity and intuition; it demands a rigorous commitment to quantifiable outcomes. Throughout this guide, we’ve explored seven powerful frameworks designed to embed this discipline into your operations. From the foundational clarity of SMART goals and the strategic alignment of a Balanced Scorecard to the iterative precision of A/B testing and Lean Analytics, each approach offers a unique lens through which to view and improve performance. The journey from abstract objectives to tangible, measurable results is not about adopting every methodology at once. Instead, it’s about strategic selection and thoughtful implementation.
The true power of these frameworks is unlocked when they transition from theoretical concepts on a slide deck to the driving force behind your daily activities. This is where a culture of accountability and data-informed curiosity becomes your greatest asset. When your team begins asking “How do we measure this?” or “What does the data suggest?” as a default, you are on the path to creating a sustainable engine for growth. This cultural shift transforms marketing from a perceived cost center into an undeniable value driver, capable of demonstrating its contribution to the bottom line with confidence and clarity.
Your Path to Actionable Insights
So, where do you begin? The key is to start small, build momentum, and make the process manageable. Don’t try to implement a complex Six Sigma project and a company-wide OKR rollout simultaneously.
Here are your immediate next steps:
- Assess Your Current State: Which framework resonates most with your team’s current challenges and maturity level? A startup might benefit immensely from the speed of Lean Analytics, while a larger, more established enterprise might find the structure of a Balanced Scorecard essential for alignment.
- Select a Pilot Project: Choose one specific campaign or initiative to apply your chosen framework. Whether it’s setting SMART goals for your next product launch or using A/B testing to optimize a critical landing page, a focused pilot project will provide valuable learnings without overwhelming your team.
- Document and Share Learnings: The outcome of your pilot, whether a resounding success or a lesson in what not to do, is valuable data. Document the process, the results, and the insights gained. Share these findings widely to build buy-in and demonstrate the power of a data-driven approach.
The Ultimate Goal: A Cycle of Continuous Improvement
Mastering these concepts is not a one-time task but a commitment to a perpetual cycle of planning, executing, measuring, and optimizing. By embedding these practices into your workflow, you create a feedback loop that consistently elevates performance. You move beyond simply reporting on what happened and begin to strategically influence what happens next. This is how you build resilience, adapt to market changes, and ultimately ensure that every marketing dollar is invested with purpose and precision, delivering the measurable results that define success.
Ready to transform your marketing data into a decisive competitive advantage? ReachLabs.ai specializes in building and executing robust measurement strategies that drive predictable growth. Visit ReachLabs.ai to discover how our data-driven approach can help you achieve the measurable results your business deserves.


