Instagram Insights is your brand’s secret weapon, the built-in analytics tool that turns fuzzy audience interactions into a clear, actionable roadmap for growth. It’s what helps you stop guessing what your followers want and start knowing what truly connects with them. The best part? This powerful tool is completely free for anyone with an Instagram Business or Creator account.
What Are Instagram Insights and Why Do They Matter
Think of Instagram Insights as your strategic compass, not just another dashboard full of numbers. It’s the tool that tells the story behind your performance, translating every click, view, and follow into a straightforward narrative about what’s working and what’s falling flat. Without this data, your content strategy is pretty much a shot in the dark.
This guide will help you look past the confusing metrics and start making smart decisions that actually drive results. When you understand these analytics, you open a direct line to your audience’s habits, their content preferences, and their engagement patterns. It's the difference between just posting content and hoping for the best versus creating content that’s engineered for success from the start.
From Raw Data to Strategic Advantage
At its heart, Instagram Insights is all about helping you answer the tough questions. Is my content reaching the right people? Are my followers actually paying attention? Is my Instagram activity helping my business in a tangible way? Digging into this data lets you spot trends that can shape every piece of your strategy. For instance, if you notice a huge spike in engagement every time you post a behind-the-scenes Reel, you’ve just found a goldmine—it's time to make more of that.
The sheer size of Instagram's audience makes these analytics incredibly important. The platform has nearly 2 billion monthly active users, making it an absolute giant for marketers. Its advertising reach alone hit 1.74 billion people, and it's still growing faster than many of its competitors. To succeed here, you have to understand this audience, and Insights gives you the demographic and behavioral data you need to do just that.
By the end of this guide, you'll see Insights not as a reporting chore, but as your most powerful asset for creating a content strategy that consistently hits the mark, builds community, and achieves your business goals.
Ultimately, using Insights is about working smarter, not just harder. It lets you:
- Identify Top-Performing Content: Pinpoint exactly which posts, Stories, and Reels grab the most attention so you can replicate that magic.
- Understand Your Audience: Get to know your followers—where they live, their age range, and precisely when they’re most active online.
- Optimize Your Posting Schedule: Stop posting randomly and start sharing content when your audience is most likely to see and interact with it.
- Track Growth and ROI: Keep a close eye on follower growth, reach, and engagement to connect your social media work directly to business results.
This whole process is key to proving the value of your social media efforts. If you want to explore the bigger picture, a great guide on social media analytics and reporting offers a solid foundation. Even more importantly, getting comfortable with these metrics is the first step in learning how to measure social media ROI the right way.
How to Find Your Way Around the Insights Dashboard
Jumping into your Instagram analytics for the first time can feel like trying to fly a plane without any training. But once you get a feel for the controls, you'll see it’s built to give you surprisingly clear answers about what's working and what isn't. Think of this dashboard as your mission control for understanding your audience.
First things first, you need to know how to get there. Just head to your professional profile and tap the "Insights" button. You'll usually find it right under your bio or tucked away in the hamburger menu (the three lines) in the top-right corner. That one tap opens up a whole world of data.
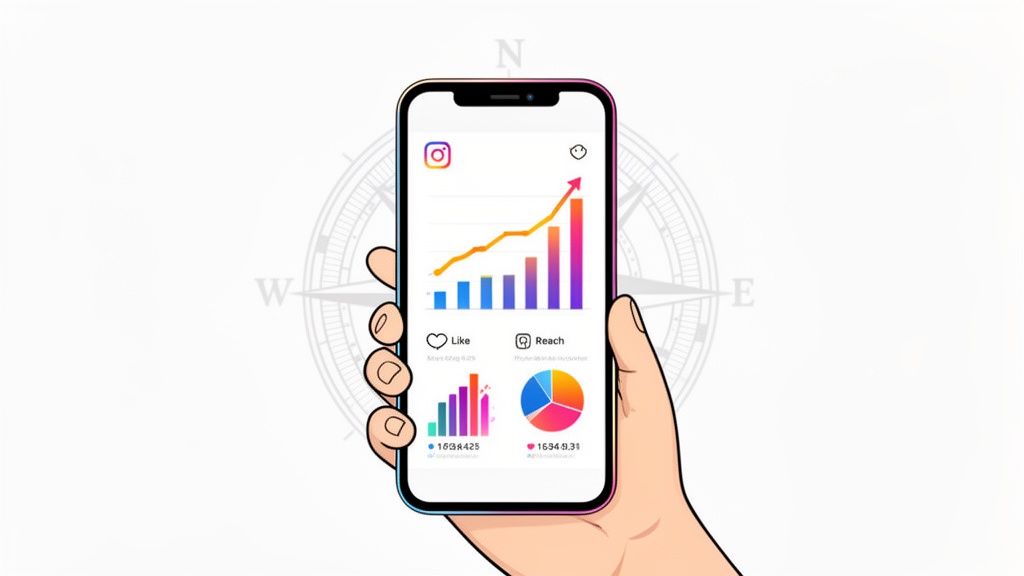
Here’s a look at the main overview you'll see. It's designed to give you a quick, at-a-glance summary of how your account is doing.
This snapshot is your account's health check. It compares key stats like Accounts Reached and Engaged Audience against the previous period, so you can immediately spot if you're on an upward trend or if things have dipped.
The Three Big Questions Insights Answers
The main dashboard is essentially organized to answer three fundamental questions about your performance. Getting a handle on these three areas is the foundation for building a solid Instagram strategy. You'll see them right when you open your Insights.
-
Accounts Reached: This is your "Who saw my stuff?" number. It tracks the total count of unique accounts that have seen any of your content. This is your top-level metric for pure visibility.
-
Accounts Engaged: This is your "Did they care?" metric. It counts how many unique people actually interacted with your content—we're talking likes, comments, saves, and shares. High engagement is a sign that your content is truly hitting the mark.
-
Total Followers: This is your "Is my community growing?" report. It shows your follower count over time, including growth trends and a deep dive into who your audience actually is.
The real magic happens when you see how these three work together. For instance, massive reach with tiny engagement might mean your content is getting seen but isn't very interesting. On the flip side, low reach but super high engagement could mean you have a small but incredibly loyal fanbase. Your goal is to get all three growing together.
Picking the Right Timeframe for Your Analysis
One of the most useful features baked into the Insights dashboard is the ability to change the date range. Instagram usually defaults to showing you data from the "Last 7 Days," but with a quick tap, you can switch it to the "Last 14 Days," "Last 30 Days," or even the "Previous Month."
This isn't just a minor feature; it's essential for smart analysis.
- A 7-day view is great for checking the immediate results of a new Reel or a special promotion.
- A 30-day view gives you a much better sense of your overall performance, ironing out any weird daily spikes or dips to show you the real trends.
- Comparing the previous month to the current one is perfect for tracking your month-over-month growth and spotting any seasonal changes in your performance.
Getting into the habit of switching between these views is what separates casual posting from strategic content creation. It helps you see both the forest and the trees—the immediate reaction to a single post and the long-term health of your account. This is what makes Insights a powerful tool, not just a simple report card.
Understanding Your Core Performance Metrics
To really get a handle on Instagram, you have to learn to speak its language—the language of data. Your core performance metrics are the numbers that tell the story of your content's journey, from the moment it hits someone's screen to the action they take afterward. This isn't about memorizing dry definitions; it’s about understanding human behavior.
Think of it like giving a speech. These metrics help you figure out not just how many people were in the room, but who was actually listening, who was taking notes, and who was inspired enough to chat with you afterward. This flowchart maps out the three main pillars you'll be navigating in your Insights.
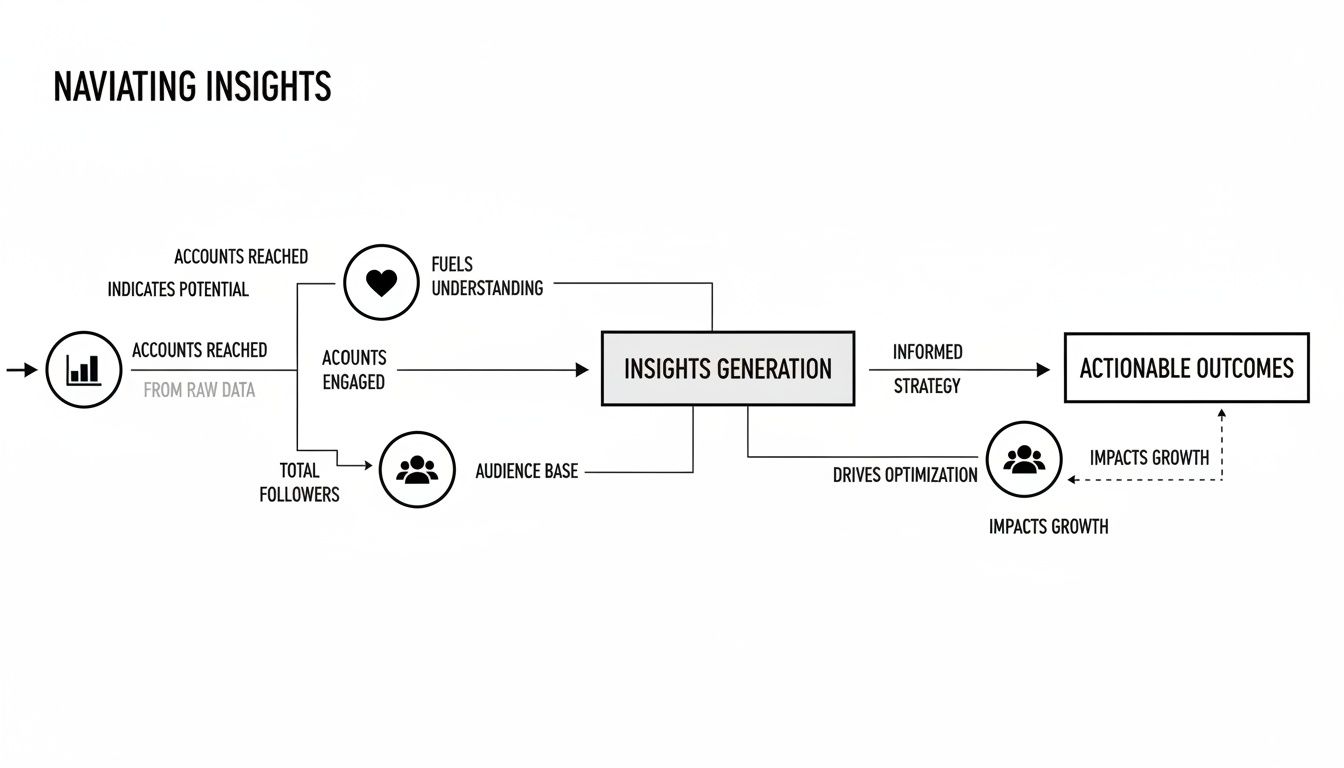
As you can see, the path flows from understanding who saw your content (Accounts Reached), to who actually interacted with it (Accounts Engaged), and finally, to who makes up your community (Total Followers).
Reach vs. Impressions: Getting The Full Picture
Let's start with two of the most fundamental—and most commonly confused—metrics: Reach and Impressions. They sound similar, but they tell you two very different things about who's seeing your content.
-
Reach tells you how many unique accounts saw your post. Think of your post as a billboard on a busy highway; reach is the total number of individual cars that drove past it. Each car is only counted once, no matter how many times it loops around.
-
Impressions are the total number of times your post was seen. Sticking with the billboard analogy, if one car drives past your billboard three times, that counts as one person reached but three impressions.
Impressions will almost always be higher than your reach, and that's okay! In fact, a high impression-to-reach ratio can be a fantastic sign. It often means your content is so compelling that people are looking at it multiple times, or that the algorithm is serving it to the same users repeatedly in their feeds.
Engagement: The True Measure of Connection
Getting eyes on your content is great, but Engagement is where the real connection happens. This isn't just one number; it’s a collection of all the actions people take on your content. It tells you they didn't just see it—they cared enough to do something about it.
An engagement rate isn't just a vanity metric; it’s a direct indicator of your content's health and relevance. A high rate tells the Instagram algorithm that your content is valuable, which often leads to even greater reach.
Here are the key engagement actions you need to be watching:
- Likes: The classic nod of approval. They’re a good starting point but are often considered a more "passive" form of interaction.
- Comments: This is a much stronger signal. A comment means your content was interesting enough to spark a conversation.
- Shares: Think of this as digital word-of-mouth. When someone shares your post to their Story or DMs it to a friend, they're giving you a personal recommendation.
- Saves: This has become one of the most powerful metrics on the platform. A save means someone found your content so useful or inspiring that they want to come back to it later. They’re treating your content like a resource.
Tracking these metrics is foundational. For a deeper dive into how these fit into a broader strategy, you might find these marketing performance metrics examples helpful. A huge part of this is also finding the best time to post on Instagram using real data, which can give your engagement a serious boost right out of the gate.
Driving Action: Profile Visits and Website Clicks
At the end of the day, you need to connect your content performance to real business outcomes. That’s where profile-level metrics come into play, showing you if your content is actually inspiring people to take the next step.
Profile Visits tell you how many people saw a post and were curious enough to click through to your main profile page. This is a crucial step in their journey with your brand; it shows they want to learn more about who you are and what you do.
Website Clicks, tracked from the link in your bio, are often the ultimate goal. This metric shows how well your content is driving people off of Instagram and onto your website, where sales, sign-ups, and other conversions happen. If this number is low, it’s a clear sign that you might need to punch up the calls-to-action (CTAs) in your captions and bio.
Getting to Know Your Audience: Demographics and Behavior
Let's be honest, success on Instagram isn't about shouting into a crowded room; it's about starting a great conversation with the right people. This is where your audience demographics come in. Think of the "Total Followers" tab in your Insights as your roadmap to understanding exactly who is in your community.
This part of your analytics helps you move past simple follower counts and answer the real question: "Am I actually reaching the people I want to reach?" By digging into who your followers are—their age, gender, and where they live—you can see if your content is hitting the mark or if you might need to adjust your strategy.
So, Who Are Your Followers, Really?
First things first, let's look at the basic breakdown Instagram gives you: age range, gender, and top locations (both cities and countries). It’s a simple overview, but it’s incredibly powerful.
Imagine you sell sustainable activewear aimed at women between 25 and 34 in major US cities. A quick look at your Insights should confirm this. But what if you find out a huge chunk of your audience is actually men aged 18-24 in a completely different country? That’s a massive clue that your content or messaging is attracting a group you didn't expect.
This isn't just about checking a box; it's about fine-tuning everything you do. Knowing these details helps you tailor your:
- Tone of Voice: You'd talk differently to a Gen Z audience than you would to millennials.
- Content Themes: Create posts that genuinely resonate with their interests and what's going on in their lives.
- Cultural References: Make sure your jokes, memes, and examples actually land with the people watching.
Understanding Your Global Reach and Local Footprint
Your audience's location data is a goldmine, whether you're a global brand or a local shop. For bigger brands, seeing where you have the most traction can help you decide where to spend your ad budget or even which markets to expand into next. To put things in perspective, India leads the world with over 413 million Instagram users, with the U.S. and Brazil not far behind. Knowing this helps you understand why you might be seeing certain countries pop up in your top locations. You can learn more about global Instagram user stats at WorldPopulationReview.com to see how your audience stacks up.
On the other hand, if you run a local coffee shop, seeing that 90% of your followers live in your city is a huge win. If that number is lower than you'd like, it’s a clear sign to start creating more local content, using location-specific hashtags, or even partnering with other businesses and creators nearby to build a stronger local following.
When to Post: The Power of Active Times
Easily the most practical piece of information in this entire section is the "Most Active Times" chart. Don't just glance at this colorful graph—it’s a strategic game-changer. It shows you the exact days of the week and hours of the day when your followers are most often scrolling.
Think of it like this: Posting when your audience is offline is like throwing a party when all your guests are stuck at work. But posting when they’re most active? That’s how you get your content seen, ensuring it lands right at the top of their feed for maximum impact.
This one insight should directly shape your posting schedule. If your data shows a huge spike in activity every Wednesday at 6 PM, that’s your new prime-time slot. Schedule your biggest announcements, product drops, and best content for that window to get it in front of the largest possible audience right away. This is one of the clearest examples of how a deep dive into Instagram Insights explained can give you an immediate boost.
By consistently checking who your audience is and when they're paying attention, you stop just posting randomly and start building a real strategy. You can craft messages that connect, time your posts for the biggest splash, and turn your analytics into a genuine advantage. It's how you build a stronger, more connected community, one perfectly timed post at a time.
Measuring Stories and Reels Performance
While your feed posts have their own metrics, ephemeral content like Stories and Reels plays by a completely different set of rules. Their analytics tell a unique story about viewer behavior, one that’s less about static engagement and more about capturing attention and creating a flow.
To really nail short-form video, you have to get comfortable with these insights. These formats are fast-paced, and their data reflects that. We’re not just looking at likes and comments anymore; we're analyzing how people move through your content. Are they hooked, or are they skipping ahead? The answers are waiting in the data.
Decoding Viewer Behavior in Instagram Stories
Think of your Story analytics as a play-by-play of your viewer's journey. These metrics go way beyond a simple view count to show you precisely how people interact with each slide. Cracking this code is the key to building a narrative that keeps people watching from start to finish.
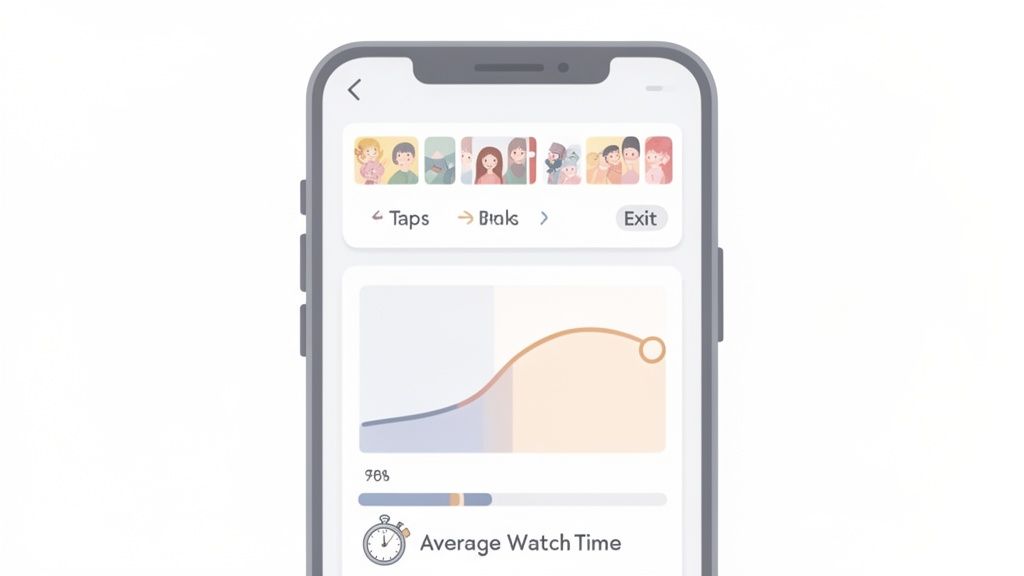
Here are the critical metrics you need to watch:
- Taps Forward: This is how many times someone tapped to skip to your next Story slide. A high number isn't always a red flag—people naturally tap through content—but a sudden spike on one slide probably means it was confusing or just not interesting enough.
- Taps Back: The opposite of a tap forward, this tracks how many times a viewer went back to rewatch the previous slide. A lot of taps back is a fantastic sign. It means your content was so compelling or detailed that people wanted a second look.
- Next Story Swipes: This number shows you how many people swiped right past your Story and moved on to the next account's content. It's a clear signal that they lost interest and bailed.
- Exits: This counts the viewers who left the Stories experience altogether to go back to their feed. An exit is a strong sign that your content just didn't hold their attention.
By analyzing these navigation patterns, you can pinpoint exactly where your story is strongest and where it's losing steam. A slide with high Taps Back is a winner, while one with a surge in Next Story Swipes needs rethinking.
Analyzing Performance for Instagram Reels
Reels are all about grabbing attention in a fiercely competitive feed. Their success isn't just measured by initial views, but by how long you can keep someone glued to their screen. The algorithm loves Reels with strong retention, making these metrics absolutely crucial for growth.
The key performance indicators for Reels include:
- Plays: Similar to a standard video view, this is the total number of times your Reel started playing.
- Average Watch Time: This metric tells you the average amount of time people spent watching your Reel. A longer watch time signals to Instagram that your content is engaging and worth showing to more people.
- Initial Plays vs. Replays: Insights helpfully separates first-time views from the times people watched your Reel again. A high number of Replays is a powerful sign that your content was entertaining, valuable, or just had a perfect loop.
While the native app is great, getting a complete picture of your video performance often requires more firepower. Many of the best social media analytics tools offer advanced dashboards that let you track these metrics over time and compare content performance far more effectively.
Stories and Reels serve different purposes, so their key metrics reflect distinct user behaviors. A "tap forward" in a Story is a simple navigation action, but a short watch time on a Reel is a direct signal of disinterest to the algorithm. Understanding this distinction is key to interpreting your data correctly.
| Metric | What It Means for Stories | What It Means for Reels |
|---|---|---|
| Replies/DMs | Indicates direct, personal connection and conversation starters. | Signals strong emotional reaction or a desire to connect privately. |
| Taps Forward/Back | Measures pacing and interest in the narrative flow. | N/A |
| Average Watch Time | N/A | A core metric for algorithmic success; shows how well you hook and hold attention. |
| Saves | Shows users found a specific slide useful for later reference (e.g., a link, a tip). | A powerful indicator of evergreen value; users want to revisit the entire video. |
| Shares | Reflects content that resonates enough for a user to send to a friend. | A key virality signal; shows content is being broadcast to new audiences. |
| Exits/Next Story | Pinpoints the exact moment a viewer lost interest. | N/A (Measured through watch time and drop-off). |
Ultimately, both formats demand attention, but the way you earn and measure that attention is different. Stories are about creating a cohesive, tappable experience, while Reels are about delivering a short, impactful, and often re-watchable punch.
Using Insights to Build Better Short-Form Video
Once you get what these numbers mean, you can turn them into a practical framework for improvement. The goal is to create a feedback loop where the data from one Story or Reel directly informs the creation of the next one.
For your Stories, keep an eye on your completion rate—the percentage of viewers who watched from the first slide to the last. If you see a massive drop-off after your third slide, maybe your stories are too long or the narrative isn't grabbing them. Try experimenting with shorter sequences or tossing in interactive stickers like polls and quizzes to keep people tapping along.
For your Reels, obsess over Average Watch Time. If your 15-second Reel only has an average watch time of 4 seconds, you know you're losing people almost immediately. Go back and study the first 3 seconds of your best-performing Reels. What was the hook? Was it a surprising visual, bold text on the screen, or an intriguing question? Find that successful formula and replicate it to boost your retention on future videos.
Turning Your Insights Into a Growth Strategy
Analytics are just numbers on a screen until you actually do something with them. This is where your deep dive into Instagram Insights starts to pay off. It’s time to stop passively collecting data and start actively building a content plan that fuels real growth.
Think of it as a series of simple "if-then" scenarios. By connecting a specific data point (the "if") to a clear, intentional action (the "then"), you create a repeatable system for getting better. This turns analysis from a chore into your most powerful growth engine.
Address Performance Gaps with Targeted Actions
Your insights will always show you what’s working and what’s falling flat. The secret is to respond to those weaknesses with precise, strategic adjustments instead of just throwing things at the wall and hoping they stick.
For example, a common problem I see is content that gets seen but doesn't make an impact.
If your Reach is high but your Engagement Rate is low, then your content simply isn't compelling enough to stop the scroll. The prescription? Make your posts more interactive.
To fix this, start experimenting with features designed to pull people in.
- Incorporate Polls and Quizzes: These Story stickers are a dead-simple way to ask questions and get people tapping.
- Host Q&A Sessions: Dedicate a Story or a Live session to answering your audience's questions. It makes them feel heard and valued.
- Write Captions that Ask Questions: Don't just talk at your audience. End your captions with an open-ended question to get a real conversation started in the comments.
Another classic issue is failing to turn attention into action. If your Website Clicks are in the gutter despite solid engagement, your call-to-action (CTA) is broken. The fix here is to get crystal clear in your bio, captions, and Stories, telling people exactly what you want them to do next.
Double Down On What Already Works
Your top-performing posts aren't just happy accidents; they're a blueprint for what to create next. Head over to the "Content You Shared" section of your Insights—it's a goldmine. Filter your posts by metrics like Reach, Saves, or Comments to see what really got your audience excited.
Once you’ve spotted your winners, play detective and look for common threads.
- Format: Are your best posts consistently Reels, carousels, or single images?
- Topic: What subjects generate the most buzz? Is it how-to guides, behind-the-scenes glimpses, or funny memes?
- Style: Do bright, punchy graphics outperform your more minimalist designs? Does a humorous tone get more traction than a serious one?
Let’s say you notice that every carousel post breaking down a complex topic gets a ton of saves. Boom. You've just found a winning formula. Your next move is obvious: build a whole content series around that exact format and topic. This data-driven approach takes the guesswork right out of your content creation.
Create a Repeatable Review Process
To make sure you’re always moving forward, you need to make reviewing your insights a regular habit. A simple monthly check-in is a fantastic place to start. Block out some time, grab a coffee, and ask yourself a few critical questions.
- What was our biggest content win this month and why? Pinpoint the post with the highest engagement or reach and figure out what made it tick.
- Where did we see the biggest drop-off? Look for Stories with high exit rates or posts with dismal engagement to learn what didn't connect.
- Did our audience demographics change? Keep an eye on any shifts in age, location, or gender.
- Are our website clicks and profile visits trending up or down? Check if your content is actually pushing people toward your business goals.
Answering these questions consistently transforms your Instagram Insights from a passive report into an active, strategic tool. You’ll create a feedback loop where every post, Story, and Reel makes the next one smarter, pushing you closer and closer to your goals.
Got Questions? We've Got Answers
Even after you get the hang of the dashboard, you’ll inevitably run into questions once you start digging into your own data. Let's tackle some of the most common ones that pop up for marketers and creators.
How Often Should I Actually Be Checking My Insights?
There's no single right answer, but a weekly check-in is a fantastic rhythm to get into. It’s the sweet spot—frequent enough to catch trends as they're happening and see how your latest posts are landing, but not so often that you get bogged down by tiny daily ups and downs.
Then, block out some time for a deeper dive once a month. This is your chance to zoom out, look at the bigger picture, track your growth from the previous month, and make those bigger, more strategic tweaks to your content plan.
Can I See Exactly Who Saved My Posts?
Nope, you can't. Instagram keeps the identities of users who save your content completely private. You’ll see the total number of saves on a post, but the "who" is always anonymous.
Think of saves as anonymous high-fives. You don't know who gave them, but a high number is a powerful signal that you’ve created something genuinely valuable—something people want to come back to again and again.
Help! Why Did My Reach Suddenly Tank?
Seeing your reach suddenly plummet is jarring, but don't panic. It's almost always explainable and rarely caused by just one thing.
A few usual suspects are often at play:
- The Algorithm Shuffle: Instagram is always fine-tuning its algorithm. A recent change might just be prioritizing different kinds of content for a bit.
- A Dip in Quality: Let's be honest, not every post is a home run. If a few of your recent posts didn't resonate as strongly, the algorithm might temporarily pull back on your visibility.
- Posting Cadence Went Sideways: If you've been posting consistently and then suddenly go quiet (or start posting way more), it can throw off the rhythm you’ve built with both your audience and the algorithm.
- Audience Fatigue: It happens. Posting too much, or too much of the same thing, can sometimes lead to your followers subconsciously tuning you out.
Before you jump to conclusions, take a close look at your recent posts and your posting schedule. More often than not, the answer is hiding right there in your own activity.
Ready to transform these numbers into a winning strategy? The team at ReachLabs.ai specializes in building data-backed campaigns that drive serious results. Find out how we can help you grow at https://www.reachlabs.ai.