Measuring marketing effectiveness isn't just about tracking clicks and impressions. It's about drawing a straight line from your marketing efforts to real business results, like revenue and customer growth. When you get this right, you transform your marketing department from a perceived cost center into a predictable, revenue-generating engine.
Building Your Measurement Framework
Tired of the guessing game? To truly prove your team's value, you have to move beyond vanity metrics like "likes" and "impressions." A solid measurement framework is your ticket to doing just that. It gives you a clear, defensible way to show how every single marketing action contributes to tangible business outcomes, turning raw data into a story that resonates with the C-suite.
This isn't just about collecting data after the fact. It's about asking the right questions before you even launch a campaign. The whole point is to build a system that connects your daily activities directly to the company's bottom line.
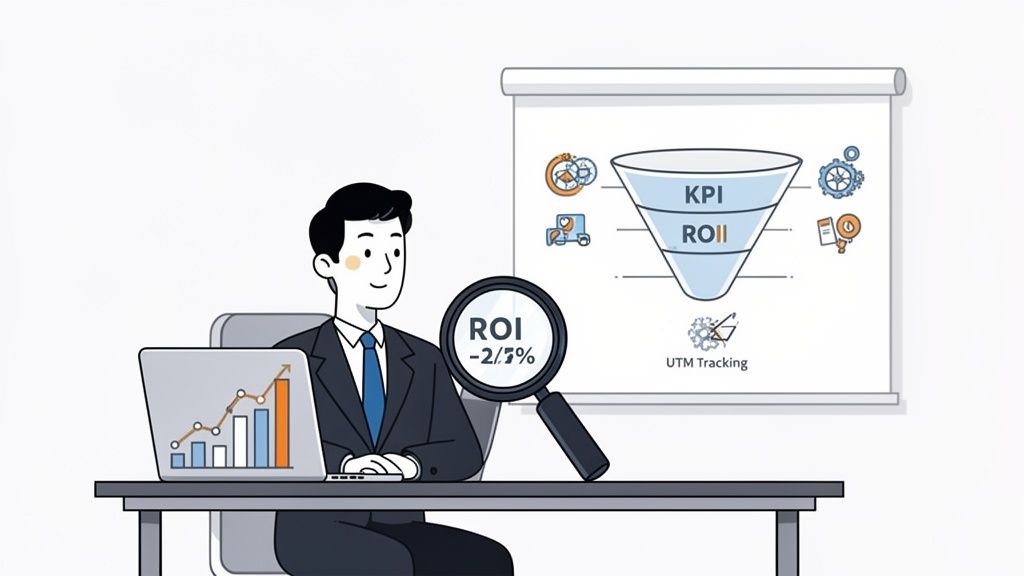
This simple flow shows you the foundational steps to get there.

As you can see, a strong framework always starts with your business goals. From there, you pick the right KPIs to measure progress, and then you set up the tracking to capture the necessary data.
Defining What Success Looks Like
Before you can measure anything, you have to know what you're aiming for. What does success actually look like for your business? Is it driving more sales, capturing a bigger slice of the market, or maybe improving customer loyalty? Each of these goals demands a completely different set of metrics. A framework built on vague goals will only ever give you vague, unhelpful data.
Choosing the right KPIs is crucial, and the answers can be surprising. For instance, Nielsen's 2025 Annual Report found that while marketers often rank radio last for effectiveness, it actually delivers a top-tier global ROI—just behind social media. This is a perfect example of the dangerous gap between perception and reality. It's proof that you have to let the data, not your gut, guide your KPI selection.
The most effective marketing measurement strategies don't just track what's easy; they track what matters. This means focusing on outcomes (like revenue and customer acquisition cost) over outputs (like emails sent or posts published).
The Core Pillars of Your Framework
To give you a roadmap of what we'll cover, the table below breaks down the essential components of a robust measurement strategy. These are the core pillars we will explore in detail throughout this guide.
| Pillar | Objective | Key Metrics Example |
|---|---|---|
| Clear Goals | Align marketing objectives directly with overall business outcomes. | Increase market share by 10% in the next fiscal year. |
| Relevant KPIs | Select metrics that accurately reflect progress toward those goals. | Marketing Qualified Leads (MQLs), Cost Per Acquisition (CPA). |
| Solid Tracking | Implement systems to gather clean, reliable, and actionable data. | UTM parameters, conversion pixels, event tracking in analytics. |
| Smart Attribution | Choose a model that reflects how your customers actually buy. | First-touch, multi-touch, or time-decay attribution. |
Getting these building blocks in place is the most critical first step, long before you start crunching complex numbers. If you're looking to zoom out even further, you might also find value in our guide on creating a broader digital strategy framework.
Aligning Marketing Goals with Business Outcomes

The single biggest mistake I see in marketing measurement happens long before anyone looks at a dashboard. It’s launching a campaign without a crystal-clear definition of what success actually looks like. Real measurement starts by drawing a straight line from your marketing goals to the company's bottom-line objectives.
Think about it this way: if the sales team is tasked with increasing enterprise accounts by 15%, your marketing goal can't just be "increase website traffic." It needs to be something like, "generate 200 marketing-qualified leads from enterprise-level companies." This critical alignment is what turns marketing from a cost center into a core part of the revenue engine.
Without this link, you're left chasing vanity metrics—numbers that sound impressive but don’t prove your value to the C-suite. At the end of the day, the CEO wants to see revenue impact, not just your social media reach.
From Broad Objectives to S.M.A.R.T. Goals
To make your goals truly actionable, you have to get specific. The S.M.A.R.T. framework is a classic for a reason—it’s the best tool for forcing clarity and accountability. It’s what moves you from a vague idea like "improve brand awareness" to a concrete target you can actually hit.
Let’s see how this plays out in the real world. Imagine a B2B tech company aiming to grow its market share. Here’s how they could translate that broad objective into a S.M.A.R.T. marketing goal:
- Specific: Increase the number of qualified demo requests from Fortune 500 companies for our new flagship software.
- Measurable: Generate 75 qualified demo requests per month through our targeted LinkedIn and content syndication campaigns.
- Achievable: Our current average is 60 requests a month. Based on past performance, a 20% lift is a stretch, but it's realistic.
- Relevant: This directly fuels the company’s objective of landing more enterprise customers and boosting annual recurring revenue.
- Time-bound: We will achieve this target within the next fiscal quarter (Q3).
With this level of detail, there’s no ambiguity. You know exactly what you’re aiming for, making it far easier to know if you're on track. It also dictates precisely which Key Performance Indicators (KPIs) you need to be watching.
Choosing KPIs That Genuinely Reflect Progress
Once your S.M.A.R.T. goals are locked in, selecting the right KPIs becomes much simpler. KPIs are the vital signs that show you're making progress toward your goal. A common pitfall here is tracking everything, which just creates noise and paralyzes decision-making.
The key is to zero in on a handful of KPIs that directly reflect the health of your marketing funnel and its contribution to the business.
Don’t confuse activity with outcomes. Publishing a dozen blog posts is an activity metric. The number of qualified leads generated from those blog posts is an outcome-focused KPI. Leadership cares about outcomes.
For an e-commerce brand focused on profitability, the most important KPIs might be:
- Return on Ad Spend (ROAS): The clearest measure of how much revenue you're generating for every dollar spent on ads.
- Customer Acquisition Cost (CAC): A crucial number showing exactly how much it costs to get a new paying customer through the door.
- Average Order Value (AOV): Tracks the average dollar amount spent per purchase, a key lever for profitability.
On the other hand, a subscription-based SaaS company would likely prioritize a different set of KPIs to measure its marketing effectiveness:
- Marketing Qualified Leads (MQLs): The raw number of leads that fit your ideal customer profile and are ready for a sales conversation.
- MQL-to-SQL Conversion Rate: This shows the quality of your leads by tracking the percentage that the sales team accepts and works.
- Customer Lifetime Value (CLV): The total projected revenue from a single customer, which informs how much you can afford to spend on acquisition.
Choosing the right KPIs is all about deeply understanding what drives your specific business model. The metrics for a local plumbing business will look worlds apart from those of a global software company. Always ask yourself this one simple question: "Does this number help us make better decisions about where to invest our time and money?" If the answer is no, it's not a real KPI for you.
Setting Your Foundation: Data, Tracking, and Attribution
Before you can measure anything, you have to get your data house in order. Without a solid foundation, any report you build is basically just a well-decorated guess. Trustworthy data is the bedrock of credible measurement, and that starts with two things: meticulous tracking and a smart approach to attribution.
This is the unglamorous part of marketing, but it's where you connect the dots between someone clicking an ad and becoming a paying customer. Think of it like the plumbing in a house—when it works, you don't even think about it. But when it's broken, with data leaking or sources getting mixed up, the whole system becomes a mess. Getting this right is non-negotiable if you want to prove your impact.
Mastering UTMs for Clean Data
One of the quickest ways marketing data gets messy is from sloppy campaign tracking. That's where UTM parameters come in. They're just simple tags you add to your URLs that tell analytics platforms exactly where your traffic came from. When used correctly, they are your best defense against data chaos.
The secret isn't just using them; it's using them consistently. A lack of a standardized naming system is a recipe for disaster. I've seen countless analytics accounts where utm_source=linkedin, LinkedIn, and linkedin.com show up as three separate sources, making it impossible to get a clear picture of performance.
To stop this from happening, create a simple, team-wide system.
utm_source: The platform where the traffic originates (e.g.,google,facebook,newsletter). Always use lowercase.utm_medium: The marketing channel (e.g.,cpc,social,email,organic).utm_campaign: The specific campaign name (e.g.,q3-promo-2024,summer-sale).utm_content: Used to differentiate ads or links within the same campaign (e.g.,video-ad-1,sidebar-banner).utm_term: Typically for paid search to identify specific keywords.
A simple spreadsheet shared with your team is all it takes to keep everyone on the same page. This single step will give you clean, aggregated data you can actually trust.
Choosing the Right Attribution Model
Once you're tracking traffic cleanly, the next question is a big one: when a customer interacts with multiple ads, emails, and blog posts before buying, who gets the credit? This is the core of marketing attribution. As you build the groundwork for accurate measurement, understanding fundamental concepts like What Is Marketing Attribution is critical for making sense of your customer journey data.
Here’s the thing: there is no single "best" model. The right choice depends entirely on your business, your goals, and how long it typically takes for someone to become a customer.
A common mistake I see is a B2B company with a six-month sales cycle defaulting to a Last-Touch model. This completely ignores all the blog posts, webinars, and social ads that introduced the customer to the brand months earlier.
Let's break down the most common models with some real-world context.
| Attribution Model | How It Works | Best For |
|---|---|---|
| First-Touch | Gives 100% of the credit to the very first touchpoint a customer had. | Businesses focused on top-of-funnel awareness and demand generation. |
| Last-Touch | Gives 100% of the credit to the final touchpoint before conversion. | Short sales cycles and campaigns focused on driving immediate action. |
| Linear | Distributes credit equally across all touchpoints in the customer journey. | Long sales cycles where you want to value every interaction equally. |
| Time-Decay | Gives more credit to touchpoints that happened closer to the conversion. | Nurture-heavy marketing where recent interactions are more influential. |
| Data-Driven | Uses machine learning to assign credit based on your historical data. | Businesses with enough conversion data for the algorithm to find patterns. |
An e-commerce brand running a flash sale might find Last-Touch attribution works perfectly, since the goal is an immediate purchase. But a high-end software company will get far more insight from a Linear or Time-Decay model that values the entire nurturing process. If you want to go deeper into the nuances, you might find our complete guide on what is marketing attribution and how to apply it useful.
Ultimately, your choice of attribution model directly shapes how you see channel performance, which in turn influences where you put your money next. Choose wisely.
Calculating Metrics That Actually Matter

Alright, you’ve got your goals defined and your tracking is humming along nicely. Now for the fun part: turning all that data into a story the C-suite will actually listen to. To show your team's real value, you have to connect your campaigns directly to financial results.
This isn't just about fluffing up a quarterly report. It’s about making smarter bets with your budget. When you know exactly what a campaign delivered in dollars and cents, you can double down on what’s working and confidently kill what isn’t.
Return on Marketing Investment (ROMI): The Bottom Line
Let's start with the big one: Return on Marketing Investment (ROMI). It’s the most direct measure of profitability and the first number your CFO will ask for. Simply put, it tells you how much revenue you generated for every dollar spent on marketing.
The formula itself is straightforward:ROMI = (Revenue Attributable to Marketing - Marketing Cost) / Marketing Cost
The classic mistake here is getting the "Marketing Cost" wrong. To calculate an honest ROMI, you have to include everything, not just the obvious stuff.
- Ad Spend: The direct cost of your media buys on platforms like Google Ads or Facebook.
- Tool Subscriptions: Don't forget your marketing automation, analytics software, and the rest of your tech stack.
- Creative & Content: Any budget spent on freelance designers, writers, or agency partners.
- Team Salaries: Yes, even a portion of your team's salaries allocated to the campaign should be in there.
If you leave out salaries and overhead, you’ll end up with a wildly inflated ROMI that gives you a false—and dangerous—sense of success.
Customer Lifetime Value (CLV): The Long Game
While ROMI is perfect for judging a specific campaign, Customer Lifetime Value (CLV or CLTV) gives you a much more strategic, long-term view. It's an estimate of the total profit you'll make from a customer over their entire relationship with your brand.
Thinking in terms of CLV shifts your focus from a single sale to building real, lasting relationships. It's the number that tells you just how much you can afford to spend to acquire a new customer and still come out ahead.
CLV forces you to look beyond the first purchase. It’s a powerful reminder that a small bump in customer loyalty can have a massive impact on your bottom line.
A simple way to calculate it is:CLV = (Average Purchase Value) x (Average Purchase Frequency) x (Average Customer Lifespan)
For a SaaS business, this might be even easier, focusing on average monthly recurring revenue (MRR) and customer churn. If you want to get more granular, you can even apply a 7-metric framework that proves marketing impact to specific initiatives like webinars.
LTV:CAC Ratio: The Health Check for Growth
This brings us to what might be the single most important metric for a growing business: the LTV to CAC ratio. This compares the lifetime value of a customer (LTV) to the cost of acquiring them (CAC). It’s the ultimate pulse check on your marketing's profitability and the long-term health of your entire business model.
A healthy LTV:CAC ratio is widely considered to be 3:1 or better. For every dollar you spend to get a customer, you should be making at least three back over their lifetime.
- A 1:1 ratio means you’re just breaking even. Not a winning strategy.
- A ratio below 1:1 is a red flag—you're losing money on every new customer.
- A very high ratio, like 5:1 or more, might actually mean you’re underinvesting in growth and leaving money on the table.
Think of this ratio as the guardrails for your budget. It stops you from pouring cash into flashy but unprofitable channels and points you toward the ones that attract your most valuable customers.
While these core financial metrics are your foundation, it's also critical to understand if your marketing is actually creating new business or just taking credit for it. Some retail tests have shown that 60% of branded search clicks would have converted organically anyway. This is where you can dig deeper with incrementality testing to prove your marketing's true lift. Firms that master this can see 20-30% better marketing returns than those relying on gut feelings alone.
Essential Marketing ROI Metrics Comparison
To tie it all together, here’s a quick breakdown of these three core financial metrics and when to pull each one out of your toolkit.
| Metric | What It Measures | Primary Use Case |
|---|---|---|
| ROMI | The direct profit generated from a specific marketing campaign or activity. | Evaluating the short-term financial success of individual campaigns (e.g., a PPC campaign). |
| CLV | The total predicted revenue a single customer will generate over their lifetime. | Informing long-term strategy, retention efforts, and customer segmentation. |
| LTV:CAC | The ratio of a customer's lifetime value to their acquisition cost. | Assessing the overall profitability and sustainability of your business model. |
Using these three metrics together gives you a complete picture—from the immediate impact of a single campaign to the long-term health and scalability of your entire marketing engine.
Moving to Advanced Models for Deeper Strategic Insights

Once you've got a solid handle on the foundational metrics, it's time to dig deeper. You need a more strategic view of what’s really moving the needle. While attribution models are fantastic for making tactical, channel-level tweaks, they often miss the bigger picture.
This is where advanced modeling techniques come in. They help you answer the tough, high-stakes questions about your budget and overall strategy. These sophisticated models look far beyond simple digital touchpoints, allowing you to finally prove the value of those hard-to-track initiatives like brand campaigns, PR, and even offline events.
Getting a Holistic View with Marketing Mix Modeling
One of the most powerful tools in this arena is Marketing Mix Modeling (MMM). Think of it as a top-down, panoramic view of your entire marketing ecosystem. Instead of trying to connect every single user journey, MMM uses statistical analysis on historical data to see how all your different inputs work together to impact a key outcome, like total sales or new sign-ups.
There's a reason MMM is gaining so much traction. A July 2024 study from EMARKETER found that over 61% of marketers are now using MMM to refine their strategies, especially as privacy changes and ROI pressure mount.
What makes MMM so valuable is its ability to account for the things that standard attribution completely misses:
- Offline Marketing: It can actually measure the impact of your TV ads, billboards, and radio spots on digital sales.
- External Factors: It can factor in seasonality, economic shifts, what your competitors are doing, and even things like weather patterns.
- Brand Building: It’s a game-changer for showing the long-term value of brand awareness campaigns that don't generate immediate clicks.
By crunching a few years of data, MMM helps you see the true incremental lift from each channel. It’s how you can confidently tell your CFO, "For every $1 we invest in PR, we see a $4 lift in overall revenue," without needing a direct click path to prove it. If you're curious about the nitty-gritty, our article on what is marketing mix modeling is a great place to start.
Building Smart Dashboards and a Reporting Cadence
All this advanced modeling is worthless if the insights get lost in a spreadsheet. The final piece of the puzzle is building a reporting system that delivers clear, actionable information to the right people at the right time. A one-size-fits-all report just won't cut it.
The frequency and detail of your reports should change depending on who you're talking to. A smart reporting rhythm ensures everyone gets what they need to make better decisions without being buried in data they don't care about.
A great dashboard doesn't just display data; it answers questions. Before building any report, ask yourself: "What decision will this report help someone make?"
Here’s a practical way to structure your reporting cadence:
The Marketing Team (Weekly): This needs to be granular and tactical. You're looking at campaign-level performance, conversion rates by channel, ad creative results, and how you’re pacing against monthly targets. The goal here is immediate, in-the-weeds optimization.
Department Heads (Monthly): Time to zoom out a bit. This report should focus on channel efficiency and progress toward quarterly business goals. Highlight metrics like Cost Per Acquisition (CPA), Marketing Qualified Leads (MQLs) by source, and channel-specific ROMI.
The C-Suite (Quarterly): This is all about high-level business impact. Leadership wants the big picture, connecting marketing spend directly to the bottom line. Stick to the heavy hitters: overall ROMI, LTV:CAC ratio, marketing’s contribution to the sales pipeline, and market share growth.
By tailoring your dashboards this way, you create a culture of accountability and data-driven thinking. It’s how you transform your data from a pile of numbers into a strategic asset that fuels growth and proves marketing's value to the entire business.
Common Questions About Measuring Marketing
Even with a perfect framework, you're going to have questions once you start digging into the data. The world of marketing analytics is full of nuance, and it's incredibly easy to get turned around or just feel overwhelmed by it all.
Let's tackle some of the most common questions we hear from marketers. My goal here is to give you clear, no-nonsense answers that cut through the noise and give you the confidence to push forward.
What Is the Most Important Metric for Marketing Effectiveness?
This is the million-dollar question, isn't it? The most honest answer I can give you is: there isn't one. The "most important" metric is entirely dependent on your specific business goals. A single "best" metric is a myth because success looks completely different from one company to the next.
For instance, an e-commerce brand obsessed with immediate sales might live and die by its Return on Ad Spend (ROAS). For them, it’s the cleanest, most direct signal of a campaign's success.
On the flip side, a B2B SaaS company with a six-month sales cycle would find ROAS almost useless. Their marketing effectiveness is better measured through leading indicators like Marketing Qualified Leads (MQLs) and Customer Acquisition Cost (CAC), which map to a much longer and more complex buying journey.
The real goal isn't to find a single silver-bullet metric. It's about building a balanced scorecard of KPIs that tells the whole story of your customer's journey—from their first interaction with your brand all the way to long-term profitability.
How Often Should I Report on Marketing Performance?
Your reporting cadence should never be a one-size-fits-all schedule. The right frequency comes down to two things: the metric you're looking at and the audience you're presenting to. Trust me, showing your CEO daily click-through rates is just going to create noise and unnecessary questions.
I like to think of it as a pyramid. Reporting gets more frequent as you move from the strategic level down to the tactical level.
- Daily or Weekly: This is for the in-the-weeds, tactical stuff. Think ad clicks, impressions, and daily conversions. This cadence is perfect for the marketing team itself, allowing for quick pivots on live campaigns.
- Monthly: This is where you zoom out a bit to review channel performance and progress toward goals. You're analyzing which channels are pulling their weight and how you’re pacing on quarterly MQL or sales targets.
- Quarterly: Here, you're presenting the big-picture business impact to leadership. Metrics like overall ROMI and the LTV:CAC ratio need more time and data to reveal meaningful trends, making a quarterly review the right fit for the C-suite.
What Are Common Mistakes to Avoid in Measurement?
Knowing what not to do is just as critical as knowing what to do. I’ve seen countless well-intentioned measurement plans get completely derailed by a few common, and totally avoidable, mistakes.
The absolute most common error is getting distracted by vanity metrics. Things like social media likes and raw impressions can look great on a slide, but they're hollow if you can't connect them to an actual business outcome like a qualified lead or a sale.
Another huge one is inconsistent UTM tracking. When your team uses different naming conventions for sources, mediums, and campaigns, you end up with a messy, fragmented dataset that's impossible to trust. This one mistake alone can render your channel performance reports useless.
A few other classic blunders to watch out for:
- Choosing the wrong attribution model: Using a Last-Touch model for a business with a long sales cycle is a classic mistake. It completely ignores all the crucial touchpoints that built the relationship in the first place.
- Calculating ROMI incorrectly: People often forget to include all the associated costs—like team salaries, software licenses, and creative agency fees. This leads to an inflated and misleading view of your actual performance.
How Can Small Businesses Measure Effectiveness on a Budget?
You absolutely do not need an enterprise-level budget or a complex tech stack to measure your marketing impact. With a smart, focused approach, any small business can build a powerful measurement system using free and low-cost tools.
Start with the essentials. Tools like Google Analytics 4 and Google Search Console are completely free and give you a massive amount of data on your web traffic, user behavior, and SEO performance. Honestly, these two tools alone are a huge leap forward from just guessing.
Next, fire up a simple spreadsheet to create and manage a consistent UTM naming convention. This costs nothing but is one of the single most impactful things you can do to keep your data clean from day one.
Instead of trying to track dozens of metrics, zero in on the handful that directly impact your bottom line. Focus on things you can calculate easily, such as:
- Conversion rates on key landing pages
- Cost per lead from your ad campaigns
- A basic estimate of customer lifetime value
Even this simple level of tracking will give you powerful insights and help you put your limited budget where it will make the biggest difference.
Ready to stop guessing and start proving your marketing's impact? The team at ReachLabs.ai specializes in building data-driven strategies that connect every marketing action to real business outcomes. We'll help you build the framework to measure what matters and drive predictable growth. Learn more and get in touch with our experts today.

