
Building Your Campaign Measurement Foundation
Let’s be real, most campaigns tank not because they’re poorly run, but because no one bothered to figure out how to measure success beforehand. I’ve chatted with so many marketing directors who’ve learned this the hard way. They really wished they’d spent more time defining what “winning” actually meant before kicking things off. This isn’t about chasing vanity metrics like likes and shares. It’s about tying your campaign activities to real business results.
This means making sure your Key Performance Indicators (KPIs) align with your core business goals. For a lead generation campaign, your main KPI might be the number of qualified leads you bring in. If you’re aiming for brand awareness, then maybe reach and share of voice make more sense. The trick is picking metrics that truly show the impact your campaign is supposed to have. I remember working with a SaaS company that was obsessed with website traffic. Clicks were through the roof, but trial sign-ups were completely flat. We switched the focus to conversion rate and saw a 20% jump in trial sign-ups within two months, even though traffic dipped slightly.
Setting Realistic Benchmarks
After you’ve nailed down the right KPIs, setting realistic benchmarks is key for gauging how well your marketing campaign is doing. These benchmarks should be based on things like your industry, the size of your audience, and how your past campaigns have performed. Don’t compare your brand new startup’s metrics to those of a Fortune 500 company. Look at competitors of a similar size, or your own historical data, to get a sense of what’s reasonable. You might find this helpful: data-driven marketing strategy.
Tracking the Right Metrics
Figuring out if a marketing campaign is successful means keeping an eye on several different metrics, not just one or two. You want to make sure everything is moving towards your business objectives. A good strategy is to use a combination of financial and cultural metrics. For example, Return on Ad Spend (ROAS) and Cost Per Acquisition (CPA) are essential for understanding how efficiently you’re spending your advertising budget across different regions. Experts these days are really emphasizing the importance of tracking conversion rates by region. This helps you understand how well your campaign is resonating with specific target audiences in different countries. You can find more about this here. This regional data lets you see which areas are doing great and which ones need a little extra love, allowing you to adjust your budgets and targeting on the fly. Building a solid foundation for measurement ensures you’re not just collecting data, but actually using it to steer your campaign in the right direction.
Here’s a handy table I’ve put together to help you think about the KPIs that matter most for different campaign types. It also gives you a general idea of benchmark ranges, but remember, those are just starting points. Your specific benchmarks will depend on your unique circumstances.
Essential KPI Categories by Campaign Type
A comparison of primary metrics to track based on different marketing campaign objectives and channels
| Campaign Type | Primary KPIs | Secondary Metrics | Benchmark Range |
|---|---|---|---|
| Brand Awareness | Reach, Share of Voice, Impressions | Website Traffic, Social Engagement | Reach: 10-30% of target audience Share of Voice: 10-20% of industry average |
| Lead Generation | Qualified Leads, Conversion Rate, Cost Per Lead (CPL) | Click-Through Rate (CTR), Form Submissions | Conversion Rate: 2-5% CPL: $20-$100 (depending on industry) |
| Sales | Revenue Generated, Return on Ad Spend (ROAS), Customer Lifetime Value (CLTV) | Average Order Value (AOV), Sales Conversion Rate | ROAS: 3:1 or higher Sales Conversion Rate: 1-3% |
| Customer Retention | Customer Churn Rate, Customer Lifetime Value (CLTV), Repeat Purchase Rate | Customer Satisfaction (CSAT), Net Promoter Score (NPS) | Churn Rate: < 5% Repeat Purchase Rate: 20-40% |
This table highlights how important it is to choose KPIs that are specifically aligned with your goals. Don’t just track everything – focus on the metrics that truly matter for your campaign’s success. With the right metrics and benchmarks in place, you can confidently analyze your campaign performance and make data-driven decisions to improve future efforts.
Mastering the Financial Metrics That Actually Matter
Look, let’s be honest: understanding the financial side of marketing is what separates the pros from the amateurs. It’s not just about calculating basic ROI; it’s about using those nuanced financial metrics to really demonstrate your campaign’s value and, let’s face it, justify bigger budgets later. I’ve seen it happen – the right financial metrics can transform a boring marketing report into a compelling story that gets executives on board.
Beyond Basic ROI: Diving Deeper into Financial Success
While Return on Investment (ROI) is important, it doesn’t tell the whole story. It’s kind of like judging a book by its cover. You need to dig deeper, looking at metrics like Return on Ad Spend (ROAS) and Customer Lifetime Value (CLTV). ROAS shows you how much revenue each advertising dollar generates, giving you a much clearer picture of campaign profitability. CLTV, on the other hand, reveals the long-term value of every customer you acquire. This is huge for subscription-based businesses or those relying on repeat purchases. Understanding CLTV lets you invest more strategically in snagging those high-value customers. If you’re interested in diving deeper into ROAS, check out our guide on how to calculate it.

Speaking the CFO’s Language: Presenting Financial Data Effectively
Presenting financial data is a skill. You could have the most profitable campaign ever, but if you can’t communicate its value, it’ll just look like a waste of money. I once watched a marketing team lose funding for a highly successful campaign just because they presented the data poorly, confusing the CFO. The key is clarity and conciseness. Use visuals like charts and graphs – they make the data digestible. And, critically, clearly link your metrics to business outcomes. Show exactly how your campaign boosted revenue growth, saved money, or increased market share.
Attribution Modeling: Tracking Revenue Across Complex Journeys
Customer journeys these days are rarely straightforward. People interact with your brand across multiple touchpoints before they finally buy something. Attribution modeling helps you understand the role each touchpoint plays in driving conversions. It’s not about giving all the credit to the last click. It’s about understanding the influence of every interaction, from social media engagement and email marketing to paid advertising. By grasping the customer journey, you can optimize your spending and focus on the channels that truly drive conversions. This nuanced approach gives you a far more comprehensive measure of your marketing campaign success.
Decoding Engagement Signals That Predict Success
Forget vanity metrics. I’ve seen campaigns with tons of likes and shares that barely moved the needle. It’s like a crowded party where no one buys a drink. We want engagement that actually delivers results.
Identifying Meaningful Engagement Metrics
So, how do we measure engagement that matters? It’s about looking beyond the surface. Think dwell time, click-through rates on specific calls to action, and meaningful comments. These show genuine interest. If you’re promoting new software, a high click-through rate on your “free trial” button is way more valuable than a pile of likes on social media.
Suppose you are running an email campaign. Opens and clicks are good starting points, but what about replies? Those show a deeper level of engagement and provide valuable feedback.
Benchmarking Engagement Across Platforms and Audiences
Here’s the thing: a 5% engagement rate on Instagram might be amazing, but that same number on LinkedIn could be a flop. Different platforms, different audiences, different expectations. Your target demographics also play a huge role. Think TikTok for younger audiences, LinkedIn for professionals. Setting realistic benchmarks based on your industry and audience is key. This helps you see what’s working and what needs tweaking.
For example, if your target audience is primarily on Facebook, comparing your Facebook engagement to benchmark data for Instagram won’t give you a useful picture.
Navigating Global Engagement and Multilingual Campaigns
Measuring success gets even more interesting with global campaigns. You’re dealing with multiple languages and regions, so look beyond the overall numbers and analyze engagement regionally. In multilingual campaigns, you need a nuanced view. Track things like brand awareness, localized engagement rates, and market penetration across languages and regions. For a deeper dive into evaluating multilingual campaigns, check out this helpful resource: Essential Metrics to Evaluate the Performance of Your Multilingual Digital Marketing Campaigns. This kind of analysis can reveal which campaign elements resonate best with different cultural groups.
Let’s say you’re running a campaign in both English and Spanish. Analyzing engagement separately for each language will give you a better understanding of what’s working in each market and inform future targeting efforts.
Predicting Conversions Through Engagement Patterns
Here’s where things get really exciting: predicting conversions through engagement. By analyzing early signals like comments, shares, and click-through rates, you can spot high-resonance content and optimize accordingly. I worked on a campaign where one blog post was getting significantly more engagement than others. We ramped up promotion on that piece and saw a 15% lift in leads. These early engagement patterns are like tea leaves – they give you valuable clues about what’s brewing and where to focus your efforts.
This isn’t just about gathering data; it’s about using it to make smarter decisions. Pay attention to those early engagement patterns, and you’ll be well on your way to maximizing your campaign impact.
Cracking the Code on Customer Conversion Paths
Let’s be honest, measuring marketing campaign success is a bit of a beast. It’s exciting to see results, but the path to those results is rarely a straight line. Customers might stumble across your ad on Instagram, browse your website a couple of times, subscribe to your newsletter, and then finally decide to buy something weeks later. Tracking this winding road can be tricky, but it’s essential if you want to understand what’s actually working.
Take a look at this infographic. It shows a snapshot of a campaign’s financial performance – how the costs stack up against revenue, the ROI, and the profit margin.
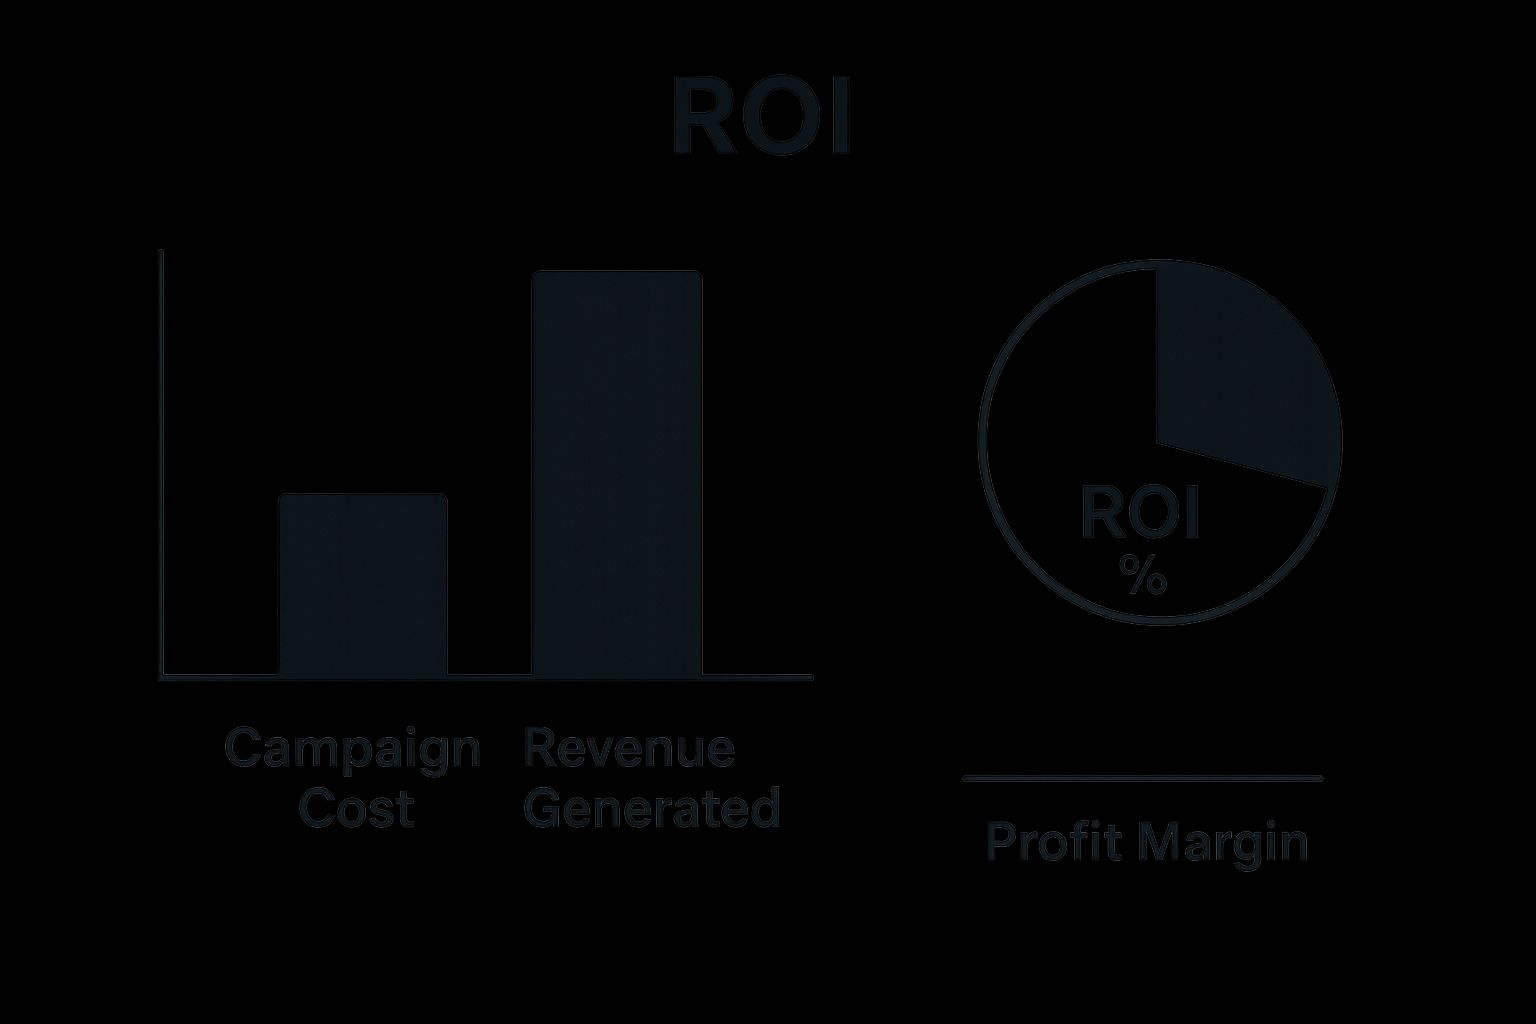
The campaign generated significantly more revenue than it cost, leading to a strong ROI and a healthy profit margin. This kind of visualization really brings home the importance of tracking those financial metrics to see if your campaigns are truly profitable. But how do you track those messy customer journeys in the first place?
Multi-Touch Attribution: Giving Credit Where Credit’s Due
Don’t worry, you don’t need a huge budget or a data science degree to understand multi-touch attribution. It’s simply about giving credit to all the touchpoints a customer interacts with before they buy something. I once worked with a client who was convinced their social media ads were a waste of money. They were focused solely on last-click attribution, completely overlooking the fact that those ads were driving a significant amount of traffic to their website, which then resulted in sales through other channels. Once we set up multi-touch attribution, they realized social media was a key player in their success story.
Leveraging First-Party Data: Understanding the Customer Journey
Savvy marketers know the power of using their own data – first-party data – to map out those customer conversion paths. This is the data you collect directly from your audience: things like website activity, email interactions, and purchase history. It’s like having a direct line to your customers’ thoughts. This data paints a clear picture of how people are interacting with your brand and what’s influencing their buying decisions.
Attribution Models: Finding the Right Fit
There’s no one-size-fits-all attribution model. Linear attribution, for instance, distributes credit equally across every touchpoint. Time decay attribution gives more weight to touchpoints closer to the conversion. The trick is finding the model that aligns with your specific business and campaign goals. In my experience, using a combination of models often gives the most holistic view.
Let’s talk about some different attribution models you might want to consider. Here’s a handy comparison table to break it down:
Attribution Model Comparison Guide
Breakdown of different attribution models, their strengths, limitations, and best use cases for various business types.
| Attribution Model | How It Works | Best For | Limitations | Setup Complexity |
|---|---|---|---|---|
| Last Click | 100% of credit to the final touchpoint | Measuring direct response campaigns | Ignores the influence of earlier touchpoints | Low |
| First Click | 100% of credit to the first touchpoint | Measuring brand awareness campaigns | Doesn’t account for touchpoints that nurture leads | Low |
| Linear | Distributes credit equally across all touchpoints | Getting a general overview of all contributing channels | Doesn’t reflect the varying importance of touchpoints | Low |
| Time Decay | Gives more credit to touchpoints closer to the conversion | Understanding the impact of later-stage touchpoints | May undervalue earlier touchpoints | Medium |
| Position Based | Allocates a higher percentage of credit to the first and last touchpoints, with remaining credit distributed evenly among middle touchpoints | Balancing brand awareness and conversion-focused efforts | Can be complex to configure accurately | Medium |
| Data-Driven (Algorithmic) | Uses statistical modeling to determine the contribution of each touchpoint | Getting the most accurate attribution picture | Requires significant data and advanced analytics tools | High |
As you can see, each model has its pros and cons. Choosing the right one (or a combination) is crucial for getting an accurate understanding of your campaign performance.
Tracking Systems: Capturing the Messy Reality
You need tracking systems in place that can handle the complexity of customer journeys. This means using tools like Google Analytics and individual platform analytics dashboards (like the ones you’ll find on Facebook Ads Manager) to collect data on every interaction. But it’s more than just collecting data; it’s about having a clear strategy for integrating and analyzing that data so it’s actually useful. You want to see the whole customer journey, not just isolated pieces. This way, you can give credit where credit’s due and make smart decisions about future campaigns.
Mining Gold From Platform Analytics
Let’s be honest, diving into analytics for different marketing platforms can feel like navigating a maze. Each one has its own quirks, its own way of presenting data. Some platforms are data-rich, some are a little… stingy. And they all seem to have hidden features that can completely change how you measure success. Instead of getting bogged down in separate dashboards, we need to focus on extracting the right insights from each platform. This gives us a clear, holistic view of how our campaigns are actually performing.
Uncovering Hidden Gems in Platform Analytics
I’ve seen so many marketers overlook some of the most powerful features within their analytics platforms. It’s like having a treasure chest and only using it to store old socks. For example, in Google Analytics, the Behavior Flow report is pure gold. It visually maps how users move through your website, showing you exactly where they drop off or get lost. This can be a game-changer for identifying areas that need improvement, like simplifying navigation or strengthening your calls to action.
On the social media side, Facebook Ads Manager offers incredibly detailed targeting. You can track performance based on super-specific demographics and interests. You might find, for instance, that your ads are resonating incredibly well with a specific age group in a particular location. This is invaluable information for refining your targeting and getting more bang for your buck. Similarly, LinkedIn Campaign Manager offers insights into how different professional audiences engage with your content. This helps you fine-tune your messaging and ad creative for maximum impact.
Standardizing Reporting and Resolving Data Discrepancies
One of the biggest pains in campaign measurement is dealing with conflicting data across different platforms. It’s incredibly frustrating. That’s why establishing a standard reporting format across all your platforms is so important. This means using the same key metrics, consistent date ranges, and identical calculation methods.
For example, if you’re tracking conversions, make sure you define a “conversion” the same way everywhere. I learned this the hard way. I once spent ages trying to figure out why my conversion numbers were so different between Google Ads and Facebook Ads. Turns out, I was tracking different actions! Identifying and resolving these discrepancies is crucial for accurate reporting and making smart decisions. For some great examples of standardized dashboards, check out these marketing dashboard examples.
Creating Unified Dashboards for Actionable Insights
Once your data is standardized, bring it all together in one unified dashboard. This gives you a comprehensive view of your campaign performance without needing a data scientist to decode it. Influencer marketing is a great example. Measuring its success requires tracking lots of different data points. A 2023 survey revealed that 79% of communications specialists used engagement data (comments, views, shares, likes) to measure success. 46% looked at product sales, and 44% focused on impressions. Discover more insights on influencer marketing campaign measurement.
A good dashboard visualizes key metrics, highlights trends, and pinpoints areas for optimization. It’s all about turning raw data into actionable insights that you can actually use to improve your campaigns.
Transforming Data Into Campaign Optimization Gold

Data without action is like a cookbook you never use. It looks nice on the shelf, but it doesn’t actually feed anyone. This section is about how to take those juicy campaign insights and turn them into real improvements—the kind that make a difference to your bottom line over time. It’s like compounding interest, but for your marketing efforts.
Uncovering Hidden Opportunities Through Systematic Analysis
Analyzing campaign data is part art, part science. It’s about finding those hidden opportunities that others miss. One of my favorite techniques is segmentation. Instead of treating your audience as one giant mass, break them down into smaller groups based on demographics, behavior, or how they interact with your campaigns.
For example, you might find that people visiting your site from social media convert at a much higher rate than those coming from search engines. That kind of nugget helps you focus your efforts where they’ll have the most impact.
Look for patterns in customer behavior, too. Are there certain times of day or days of the week when engagement is higher? Does a specific type of content resonate more than others? These patterns are like clues in a detective novel, and they can unlock some serious optimization potential. I once worked with a client who discovered their email open rates were way higher on Tuesdays. They shifted their email schedule and saw a 12% increase in click-throughs just from that one tweak.
Prioritizing Optimization Efforts for Maximum Impact
Not all improvements are created equal. Some are heavy lifts with minimal payoff, while others are low-hanging fruit ripe for the picking. That’s why it’s so important to prioritize your optimization efforts based on potential impact, budget, and ease of implementation.
Think of it this way: you wouldn’t remodel your entire kitchen just to replace a burnt-out lightbulb. Focus on the changes that deliver the biggest bang for your buck.
If you’re running a paid advertising campaign on Google Ads, optimizing your bidding strategy or refining your targeting might be far more effective than rewriting all your ad copy. It’s about figuring out which levers to pull first to get the biggest boost.
Building Feedback Loops for Continuous Improvement
The best marketing campaigns aren’t one-hit wonders. They’re constantly evolving, adapting, and improving based on the data. That’s where feedback loops come in.
A feedback loop is simply a system for continuously analyzing performance, making adjustments, and then measuring the impact of those adjustments. It’s a cycle of learning and improvement.
This constant tweaking and refining is like fine-tuning a musical instrument. Each iteration builds on the last, leading to ever-increasing campaign effectiveness. Plus, creating feedback loops builds institutional knowledge within your team. Everyone gets better at understanding what works, what doesn’t, and how to make sure your marketing budget delivers real results.
Your Campaign Measurement Action Plan
So, you’re ready to get serious about measuring your marketing campaigns. Excellent! Think of this as your personalized playbook, something that grows with you as you learn and refine your approach. We’re ditching the endless spreadsheets and complicated reports – the goal here is a system that actually works for you, not the other way around.
Building Your Actionable Playbook
Personally, I’ve found that having a good template is a lifesaver. It provides a framework for planning, setting benchmarks, and reporting on your results in a way that everyone can understand, even the non-marketing folks. Visual dashboards are my go-to; they make the data way more accessible and highlight those key metrics. I’ve even witnessed CEOs actually paying attention to marketing reports when they’re presented visually!
The goal isn’t to create some overly complex, unsustainable system. We want practices that can scale with your campaigns and your budget. Think streamlined efficiency, not reporting overwhelm.
Tracking Your Measurement Maturity
Just like your campaigns evolve, so will your measurement skills. To keep tabs on your progress, use clear indicators of your “measurement maturity.” In the beginning, you might be focused on basic metrics like website traffic. As you gain experience, you’ll naturally incorporate more sophisticated measurements, such as ROAS (Return on Ad Spend) and CLTV (Customer Lifetime Value). Don’t forget to celebrate each milestone! It’s like leveling up in a game – acknowledge your progress and give yourself (and your team) a well-deserved pat on the back.
Troubleshooting Common Measurement Challenges
Let’s be real, marketing measurement isn’t always a walk in the park. You will encounter challenges. One common headache is data discrepancies between platforms. It’s incredibly frustrating when your Google Analytics data doesn’t match your Facebook Ads data. Believe me, I’ve been there. One trick I use is to meticulously double-check my conversion definitions. Make sure a “conversion” means the same thing across all your platforms. Another frequent hurdle is getting buy-in from stakeholders. Often, they just want a simple answer: is this working or not? The key is to present the data clearly and concisely, connecting it directly to their business objectives.
By anticipating these common challenges and having solutions ready, you’ll be well-prepared to navigate the sometimes choppy waters of marketing measurement.
Ready to take your marketing to the next level with data? ReachLabs.ai can help. We offer expert guidance and support to build a measurement system that delivers real results. Learn more about how ReachLabs.ai can transform your marketing.


