
A great marketing report does more than just present data; it tells a compelling story about your performance, highlights critical opportunities, and guides strategic decisions. Yet, many marketers find themselves trapped in a cycle of simply pulling numbers without extracting actionable insights. This common pitfall leads to reports that are either ignored or misunderstood, ultimately failing to demonstrate the true value of marketing efforts to stakeholders and leadership.
In this comprehensive guide, we move beyond basic data dumps. We will deconstruct seven powerful example of marketing report formats, from high-level industry benchmarks to granular campaign analysis. For each example, we’ll break down its structure, analyze the narrative it builds, and show precisely how it connects specific metrics to overarching business goals.
You will learn not just what to report, but how to present your findings in a way that resonates with executives, justifies budgets, and drives meaningful growth. Prepare to transform your reporting process from a routine, time-consuming task into a powerful strategic weapon that informs your next successful campaign. We’ll explore templates and frameworks that you can adapt and implement immediately.
1. HubSpot State of Marketing Report: The Macro-Level Benchmark
HubSpot’s annual State of Marketing Report is less of a a single-company performance review and more of a global industry benchmark. This powerful example of a marketing report aggregates data from thousands of marketing professionals worldwide to provide a macro-level view of trends, challenges, and strategies. It’s an indispensable resource for strategic planning, demonstrating how to leverage industry-wide data to inform your own tactics.
Strategic Analysis
The genius of HubSpot’s report lies in its scope and authority. Instead of focusing on internal metrics, it provides external context that helps marketers validate their strategies and identify new opportunities. The report typically covers everything from AI integration and content marketing trends to social media platform efficacy and SEO best practices. This approach positions HubSpot as a thought leader and an essential resource, driving significant brand trust and lead generation.
Key Insight: A macro-level report transforms your marketing from a purely internal function into an industry-informed strategic powerhouse. It allows you to benchmark your performance not just against your past self but against the entire market.
Actionable Takeaways for Your Reports
You can replicate this strategy on a smaller scale to create your own compelling marketing report. Here’s how:
- Survey Your Niche: You don’t need a global audience. Survey your customers, email subscribers, or social media followers about their challenges, tool usage, and goals within your specific industry.
- Analyze Public Data: Use publicly available data, social media trend analysis, or Google Trends to identify patterns relevant to your niche. Compile these findings into a “State of [Your Industry]” report.
- Provide Benchmarks: Frame your findings as benchmarks. For example, “45% of our surveyed customers plan to increase their video marketing budget this year.” This gives your audience a valuable yardstick to measure their own plans.
By adopting this approach, you create a marketing asset that not only reports on data but also provides immense value to your audience, establishing your brand as a go-to authority. You can view their latest report on the HubSpot website.
2. Google Economic Impact Report: Proving ROI at Scale
Google’s annual Economic Impact Report takes a different approach by focusing on the tangible, real-world value its products deliver to businesses and communities. This powerful example of a marketing report is a masterclass in demonstrating ROI, blending large-scale economic data with relatable, human-centered case studies. It’s designed not just to report metrics but to build a compelling narrative about how digital tools fuel economic growth, from local bakeries to national enterprises.
Strategic Analysis
The strategic power of this report lies in its ability to translate abstract digital activity into concrete economic outcomes. By quantifying its contribution to the economy (e.g., providing $703 billion in economic activity for U.S. businesses in 2023), Google frames its marketing tools not as an expense but as a vital investment. Combining this macro data with specific success stories, like a small business increasing revenue by 300% using Google My Business, makes the impact both credible and personally resonant. This approach effectively justifies the value of digital marketing to even the most skeptical stakeholders.
Key Insight: Framing your marketing efforts in terms of economic impact and ROI transforms the conversation from costs to value creation. This moves the marketing report from a simple performance summary to a strategic document for budget justification and business growth.
Actionable Takeaways for Your Reports
You can adapt Google’s strategy to demonstrate the direct financial contribution of your own marketing activities. Here’s how to do it:
- Connect Marketing to Revenue: Go beyond vanity metrics. Use tracking tools and CRM data to directly link specific campaigns (like a Google Ads campaign) to sales conversions and customer lifetime value. Report on “Marketing-Generated Revenue.”
- Showcase Customer Success: Feature case studies from your own clients. Detail how your product or service helped them achieve tangible business outcomes, such as increased revenue, cost savings, or market expansion. Use direct quotes and specific data points.
- Create a “Business Impact” Section: Dedicate a portion of your report to summarizing the overall business impact. Frame it with a headline like, “How Marketing Drove $X in New Business This Quarter,” to immediately highlight its value.
This method shifts your report’s focus from mere activity to tangible results, making a stronger case for continued investment in your marketing initiatives. You can explore their data and stories on the Google Economic Impact website.
3. Content Marketing Institute B2B Content Marketing Report: The Niche-Specific Benchmark
The Content Marketing Institute’s (CMI) annual B2B Content Marketing Report is a masterclass in establishing niche authority. This exceptional example of a marketing report hones in on a specific segment, B2B marketers, to deliver hyper-relevant benchmarks, trends, and challenges. It serves as a vital tool for content professionals seeking to justify strategies, allocate resources, and measure success against their direct peers.
Strategic Analysis
CMI’s report succeeds by providing a focused, data-rich resource that B2B marketers can’t find anywhere else. Instead of covering the entire marketing landscape, it dives deep into the specific tactics, platforms, and metrics that define B2B content success. For instance, the 2024 report highlights that 73% of B2B marketers use content to generate leads and identifies video as a top-performing format. This targeted approach positions CMI as an indispensable partner to its audience, building immense credibility and driving engagement with its core services.
Key Insight: A niche-specific benchmark report transforms your brand into an essential authority within your industry. It demonstrates a deep understanding of your audience’s unique challenges and provides them with tailored data to make smarter decisions.
Actionable Takeaways for Your Reports
You can leverage this focused strategy to create a powerful marketing report that resonates deeply with your target audience. Here’s how to do it:
- Define Your Niche: Identify the most important segment of your audience. Are they small business owners, enterprise-level CTOs, or e-commerce managers? Focus your report exclusively on their world.
- Ask Niche-Specific Questions: Survey your audience about the tools, strategies, and pain points unique to their roles. Ask about budget allocation for specific tactics or which metrics they value most.
- Frame Insights as Peer Benchmarks: Present your findings as a reflection of their peer group. For example, “65% of B2B SaaS marketers cite ‘lack of resources’ as their biggest challenge.” This creates an immediate connection and provides actionable context.
By creating a report that speaks directly to a specific industry vertical or professional role, you deliver unparalleled value and cement your status as a trusted expert. You can find the latest report on the Content Marketing Institute website.
4. Salesforce State of the Connected Customer Report: The Customer-Centric Blueprint
Salesforce’s State of the Connected Customer Report shifts the focus from industry trends to the most critical element of business: the customer. This powerful example of a marketing report dives deep into evolving customer expectations, digital engagement preferences, and the role of trust in brand relationships. By surveying thousands of consumers and business buyers, Salesforce provides a blueprint for aligning marketing strategies with what customers actually want.
Strategic Analysis
The strategic value of this report is its customer-centricity. While many reports focus on what marketers are doing, Salesforce reveals what customers are thinking and feeling, offering an essential outside-in perspective. The report consistently highlights the growing demand for personalization, the acceleration of digital adoption, and the non-negotiable importance of trust. For example, the 2023 report revealed that 73% of customers now expect better personalization as technology advances, giving marketers a clear directive.
Key Insight: Understanding evolving customer expectations is no longer optional; it’s the foundation of effective marketing. A customer-focused report allows you to anticipate needs and build strategies that resonate on a deeper, more personal level.
Actionable Takeaways for Your Reports
You can adopt this customer-centric approach to add a powerful dimension to your own marketing reports, regardless of your company’s size. Here’s how:
- Go Beyond Performance Metrics: Instead of only reporting on clicks and conversions, incorporate customer feedback. Use survey data, support ticket trends, or product reviews to add a “Voice of the Customer” section.
- Segment by Customer Expectation: Analyze your own customer data to identify different expectation levels. Do new customers expect faster responses than long-term clients? Report on these nuances to guide your team.
- Focus on Trust-Building: Report on metrics that reflect trust, such as customer loyalty rates, repeat purchase frequency, and positive review scores. Frame these as key performance indicators for your marketing efforts.
By mirroring Salesforce’s customer-first methodology, your marketing report transforms from a simple performance summary into a strategic guide for building lasting, trust-based customer relationships. You can explore their research on the Salesforce website.
5. Social Media Examiner Social Media Marketing Industry Report: The Social Strategy Blueprint
For social media marketers, Social Media Examiner’s annual Industry Report is the definitive playbook. This powerful example of a marketing report is laser-focused on the social media landscape, compiling extensive survey data from thousands of marketers to reveal exactly how they are using social platforms, what’s working, and where the industry is headed. It’s an essential tool for validating your social media strategy and making data-driven decisions on resource allocation.

Strategic Analysis
The report’s primary strength is its granular detail on platform-specific tactics and outcomes. While other reports might cover social media broadly, this one dives deep into which platforms deliver the best ROI, the most effective content formats (like video’s superior engagement rates), and the rise of tactics like influencer marketing. This turns abstract trends into a concrete roadmap for social media teams. For example, the 2024 report highlighted TikTok’s meteoric growth, signaling a critical window of opportunity for brands to engage with a new audience.
Key Insight: A specialized industry report provides the tactical depth needed to optimize a specific marketing channel. It moves beyond high-level trends to offer specific, actionable guidance that can be implemented immediately to improve performance.
Actionable Takeaways for Your Reports
You can leverage Social Media Examiner’s focused approach to enhance your own internal reporting and external content marketing efforts.
- Benchmark Channel Performance: Use the report’s data to benchmark your own social media efforts. If the industry average for video engagement is 5x that of static posts, how do your videos measure up? This creates a clear case for budget and resource allocation.
- Identify Emerging Opportunities: The report is an early warning system for new trends. Use its findings to justify experimenting with emerging platforms or content formats before your competitors do, giving you a first-mover advantage.
- Focus on ROI: The report provides invaluable industry benchmarks for social media ROI. Use these figures to frame your own performance and make a stronger business case for your social media activities. For more on this, you can get details on how to measure social media ROI effectively.
This targeted reporting style helps you refine your social media strategy with precision, ensuring your efforts are aligned with proven industry successes. To see the data in action, you can review the findings on their website or watch a breakdown of the report.
6. Campaign Monitor Email Marketing Benchmarks Report: The Niche-Specific Guide
Campaign Monitor’s annual Email Marketing Benchmarks Report is a masterclass in providing targeted, niche-specific value. Unlike broader industry summaries, this example of a marketing report drills down into email performance metrics across dozens of specific sectors, from retail to non-profits. It offers a granular look at what success looks like, providing email marketers with the precise data needed to gauge their own campaign effectiveness against direct competitors.
Strategic Analysis
The strategic power of this report lies in its specificity. By segmenting data by industry, Campaign Monitor delivers hyper-relevant insights that general marketing reports often miss. A marketer in the government sector, for instance, can see that their average open rate of 28.77% is a top-tier achievement, not a failure compared to a different industry’s average. This level of detail empowers marketers to set realistic goals and make smarter, data-driven decisions about everything from send times to content strategy.
Key Insight: Niche-specific benchmark reports provide actionable context that is far more valuable than broad, generalized data. This allows teams to measure performance accurately and identify optimization opportunities with surgical precision.
Actionable Takeaways for Your Reports
You can leverage this focused approach to create a valuable asset, even without Campaign Monitor’s vast data set. Here’s how to apply this strategy to your reporting:
- Segment Your Own Data: Analyze your campaign performance across different customer segments, product lines, or geographic regions. Present these findings as internal benchmarks to guide future strategies.
- Focus on a Single Channel: Create a deep-dive report on your most important marketing channel, whether it’s email, social media, or paid ads. Analyze your performance over time and against any available public benchmarks.
- Provide Clear Benchmarks: Frame your data as a yardstick. For example, “Our B2B-focused emails sent on Tuesdays achieve a 5% higher click-through rate than those sent on Fridays.” This turns simple data into a strategic directive.
This approach transforms your marketing report from a simple performance summary into a powerful diagnostic tool, helping your team understand what works for your specific audience. You can find their comprehensive data on the Campaign Monitor website.
7. Gartner Magic Quadrant for Marketing Automation Platforms
Gartner’s Magic Quadrant reports are the gold standard for strategic technology evaluation, and their analysis of Marketing Automation Platforms is a prime example of a marketing report used for high-stakes decision-making. Instead of reporting on campaign metrics, this report evaluates and maps out the competitive landscape of technology vendors. It provides businesses with a powerful, impartial tool to shortlist and select the right software for their needs.
Strategic Analysis
The strategic power of the Magic Quadrant comes from its standardized, two-axis evaluation framework: “Ability to Execute” and “Completeness of Vision.” This methodology forces a holistic view, moving beyond feature lists to assess a vendor’s long-term viability, innovation, and market understanding. For example, it positions vendors like Adobe and Salesforce as “Leaders” for their robust execution and vision, while highlighting others like HubSpot for specific strengths like ease of use, placing them in different parts of the quadrant.
Key Insight: A competitive intelligence report shifts the focus from internal performance to external market dynamics. It empowers strategic decisions, like technology adoption, by providing a structured, expert-driven framework for evaluating complex options.
Actionable Takeaways for Your Reports
While you may not be Gartner, you can apply the same evaluation principles to your own internal reports to make better strategic choices.
- Create Your Own Quadrant: Evaluate potential partners, software, or even strategic initiatives on a simple two-axis grid. Define your own criteria, such as “Cost-Effectiveness” vs. “Scalability,” to visually map out your options.
- Define ‘Cautions’ and ‘Strengths’: For any tool or strategy you analyze, formally list its pros and cons, just as Gartner does. This forces a balanced assessment and highlights potential implementation challenges before you commit.
- Focus on Business Needs: The Magic Quadrant is a starting point, not a final answer. Use it to create a shortlist, then dive deeper into how each option aligns with your specific business goals, a key aspect of marketing automation best practices.
This infographic visualizes the core hierarchical components that Gartner uses to structure its Magic Quadrant analysis.
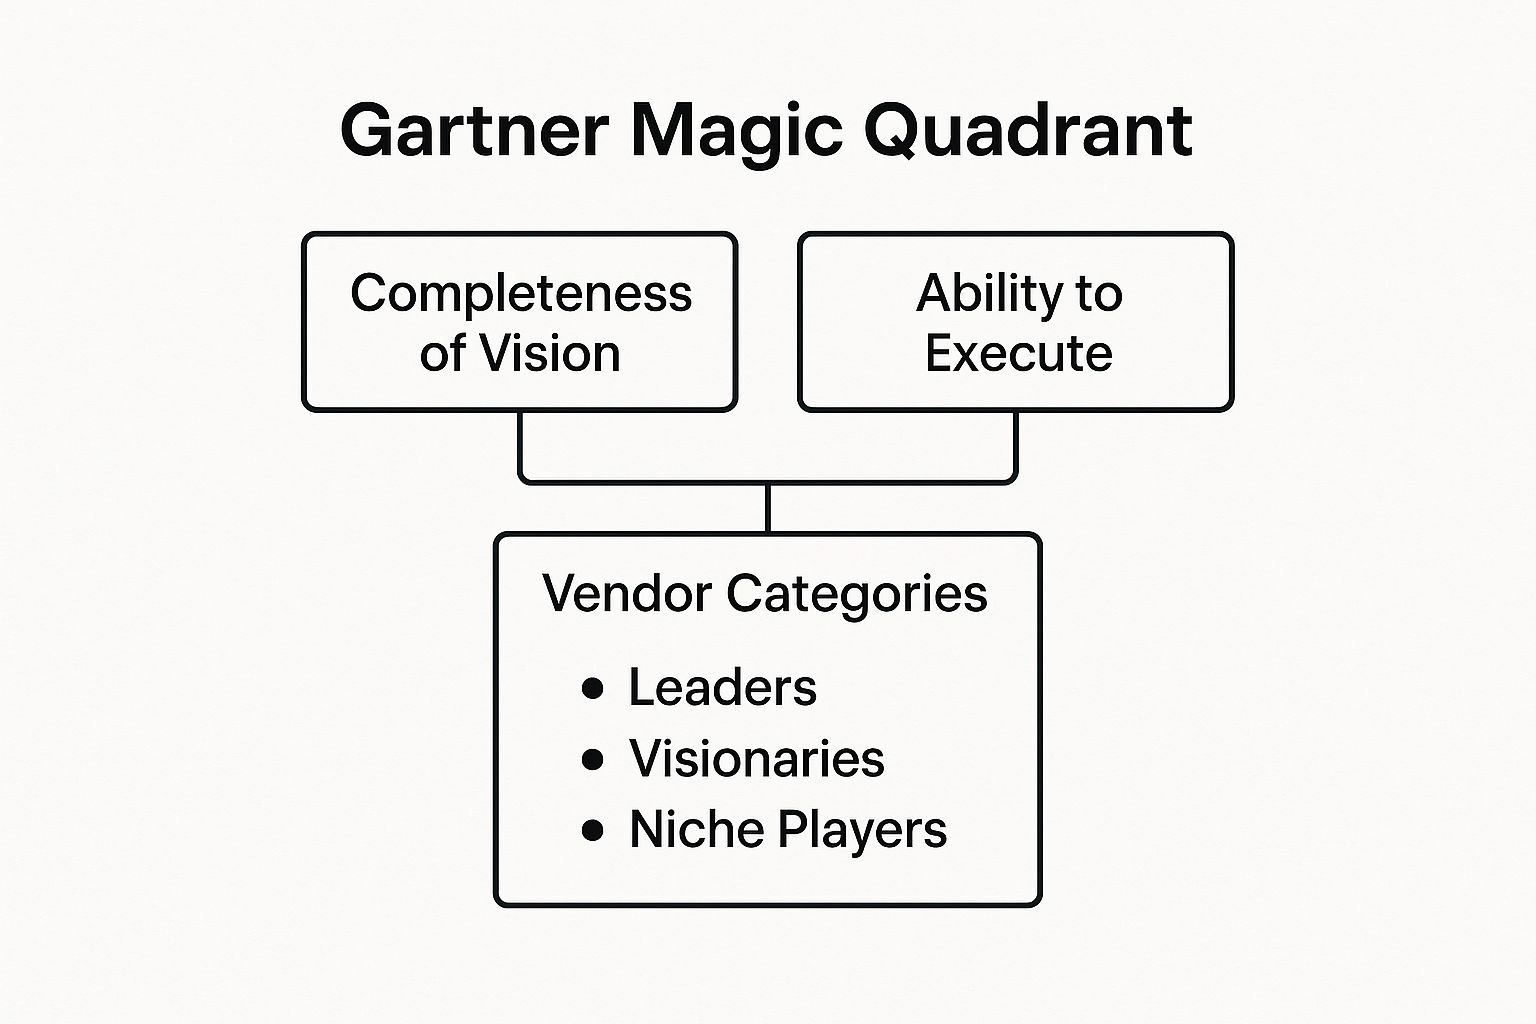
The visualization clearly shows how the two primary evaluation axes feed into the final vendor categories, providing a simple but powerful model for assessment.
7 Leading Marketing Reports Comparison
| Report Title | Implementation Complexity 🔄 | Resource Requirements 💡 | Expected Outcomes 📊 | Ideal Use Cases 💡 | Key Advantages ⭐ |
|---|---|---|---|---|---|
| HubSpot State of Marketing Report | Moderate: Annual survey and data analysis | Moderate: Access to survey data and tools | Industry benchmarks, marketing trend insights | Marketing strategy development, benchmarking | Extensive global data, actionable insights |
| Google Economic Impact Report | Moderate: Economic data aggregation and case studies | Moderate to High: Economic data + case studies | Demonstrates digital marketing’s economic ROI | Justifying marketing spend, regional market analysis | Credible economic validation, tangible impact |
| Content Marketing Institute B2B Report | Moderate: Survey focused on B2B content marketing | Moderate: Access to 1000+ content marketers | Content marketing strategy and ROI optimization | B2B content strategy, lead generation | B2B focused, clear benchmarking, trend spotting |
| Salesforce State of the Connected Customer Report | High: Large consumer and business survey dataset | High: Data from 14,000+ respondents | Customer expectations, personalization insights | Customer experience improvement, personalization | Massive dataset, B2B & B2C coverage |
| Social Media Examiner Industry Report | Moderate: Annual survey of social media marketers | Moderate: Data from 3,000+ social media marketers | Social platform trends, ROI on social marketing | Social media marketing optimization | Largest social media study, platform-specific data |
| Campaign Monitor Email Marketing Report | Low to Moderate: Email campaign performance tracking | Moderate: Email metrics from billions of sends | Email performance benchmarks, optimization tactics | Email marketing benchmarking and campaign tuning | Industry-specific benchmarks, actionable metrics |
| Gartner Magic Quadrant for Marketing Automation Platforms | High: Vendor evaluation and market analysis | High: Extensive vendor data and evaluation | Vendor positioning, strategic tech selection | Marketing automation vendor selection | Authoritative, reduces vendor selection risk |
Turning Reports into Revenue: Your Path to Actionable Insights
We’ve journeyed through a comprehensive collection of marketing report examples, each offering a unique lens through which to view performance, strategy, and industry trends. From HubSpot’s masterful use of data for thought leadership to Gartner’s structured vendor analysis, a powerful theme emerges: the most effective reports are far more than just data repositories. They are strategic instruments designed to tell a compelling story, provide crucial context, and, most importantly, catalyze decisive action.
An example of a marketing report that truly excels does not simply present what happened. It explains why it happened and, critically, prescribes what to do next. It transforms raw numbers into a narrative that stakeholders can understand and rally behind.
From Static Data to Strategic Driver
The core lesson from analyzing these diverse reports is the transition from passive data collection to active insight generation. Reports like the Content Marketing Institute’s B2B analysis and Social Media Examiner’s industry survey demonstrate how to frame data within the larger business landscape, helping marketers benchmark their efforts and identify emerging opportunities.
Your objective should be to elevate your own reporting by integrating these strategic principles. Move beyond simple metric tracking and start building a framework that connects marketing activities directly to business outcomes, just as Google’s Economic Impact Report masterfully links its platform to tangible economic growth.
Your Actionable Next Steps
Transforming your reporting process can feel daunting, but progress begins with small, deliberate steps. You don’t need to overhaul everything overnight. Instead, focus on incremental improvements that will compound over time.
Here are a few practical takeaways to implement in your very next report:
- Integrate a “Key Learnings” Section: Dedicate a small section to what didn’t work and the insights gained. This fosters a culture of testing and transparency.
- Add One Industry Benchmark: Pick a single key metric, like email open rate or social media engagement, and compare it to an industry standard using a report like Campaign Monitor’s. This immediately adds valuable context.
- Create a “Strategic Recommendations” Slide: Conclude your report with a clear, concise list of 2-3 specific actions the team should take based on the data presented. This shifts the focus from the past to the future.
By consistently applying these principles, you will slowly but surely transform your marketing reports from a backward-glancing chore into a forward-looking strategic guide. The ultimate goal is to create a reporting cadence that not only proves the value of your marketing efforts but also serves as an indispensable tool for steering the entire organization toward its growth targets. Each example of a marketing report we’ve covered serves as a blueprint for making your data work harder for you.
Ready to build a reporting framework that turns complex data into clear, revenue-driving decisions? At ReachLabs.ai, our specialists excel at crafting bespoke reporting solutions that demonstrate value and guide strategic growth. Connect with us to transform your data into your most powerful asset.


