
Understanding ROAS: The Foundation of Smart Ad Spending

Return on ad spend (ROAS) is a key metric for understanding the effectiveness of your advertising campaigns. It shows how much revenue you earn for each dollar you invest in advertising. This information is critical for making smart decisions about how you allocate your budget and optimize your campaigns.
This metric has become increasingly important in the competitive digital advertising world. For example, a ROAS of 4:1 signifies that for every $1 you spend, you receive $4 in revenue. This represents a 400% return on your initial investment. This knowledge allows marketers to pinpoint their most profitable campaigns and invest accordingly.
Understanding ROAS is essential for businesses navigating the world of digital advertising. This is mainly due to the increasing complexity of advertising platforms like Google Ads and Meta Ads Manager and the need to demonstrate a return on marketing investments. ROAS is a critical metric for measuring the effectiveness of advertising campaigns, particularly in digital marketing. Global digital ad spending is expected to reach $835 billion by 2026, a significant increase from prior years. More detailed statistics can be found here: World Advertising Industry Spend, Revenue & Statistics
Why ROAS Matters
Tracking ROAS effectively empowers businesses to make data-driven decisions and optimize their campaigns for maximum profitability. For instance, a business might discover that social media campaigns deliver a higher ROAS compared to search engine marketing.
This knowledge can inform future budget allocation strategies, allowing businesses to shift resources toward the most effective channels. This is especially crucial for managing marketing resources wisely. You might find this resource helpful: How to master your marketing resource management.
ROAS vs. Other Metrics
While metrics like ROI (Return on Investment) and CPA (Cost Per Acquisition) offer valuable insights, ROAS provides a more targeted view of advertising performance. ROI considers the overall profitability of a business, including all expenses, not just advertising costs.
CPA measures the cost of gaining a new customer, but it doesn’t directly show the revenue generated by that customer. ROAS connects advertising spending directly to revenue.
ROAS is a dynamic metric that requires continuous monitoring and adjustment. Factors such as audience targeting, ad creative, and platform selection can greatly influence ROAS. By understanding and optimizing these elements, businesses can maximize their returns and achieve sustainable growth.
The ROAS Formula That Actually Works in Practice
Calculating return on ad spend (ROAS) is essential for making informed advertising decisions. While the basic formula is simple, real-world applications can be more complex.
The Basic ROAS Formula
The core ROAS calculation is:
ROAS = Revenue / Ad Spend
For example, if you spend $1,000 on ads and generate $4,000 in revenue, your ROAS is 4 or 4:1. This translates to a 400% return, meaning for every dollar spent, you earned four back.
Addressing Real-World Complexities
The basic formula doesn’t always tell the whole story. Factors like multi-touch attribution, delayed conversions, and cross-platform tracking add layers of complexity.
- Multi-Touch Attribution: Customers often interact with your brand across multiple channels (e.g., social media, email, search ads) before purchasing. Accurately assigning revenue to each touchpoint is challenging.
- Delayed Conversions: Conversions rarely happen instantaneously. A customer might click an ad today and purchase next week. This conversion lag needs to be factored into ROAS calculations.
- Cross-Platform Tracking: Tracking conversions across different platforms (e.g., Google Ads, Facebook Ads) requires robust tracking systems.
Advanced ROAS Calculation Techniques
Marketers use advanced techniques to address these complexities:
- Multi-touch Attribution Models: These models distribute credit across multiple touchpoints, providing a more complete view of the customer journey and the effectiveness of your marketing channels.
- Conversion Windows: Analyzing conversion patterns helps determine the appropriate timeframe for attributing revenue to campaigns, accurately accounting for delayed conversions.
Segmenting ROAS for Actionable Insights
Segmenting ROAS by audience, product line, and campaign type reveals deeper insights. You might find that a specific product generates a higher ROAS when advertised to a particular demographic. This granular analysis informs budget allocation and campaign optimization.
Understanding which revenue figures to use, how to handle returns, and when to adjust your calculation approach are vital for accurate ROAS measurement. Mastering these transforms ROAS from a simple metric into a powerful tool for advertising success.
Platform Performance Reality Check: Where Your Ad Dollars Work Hardest
Not all advertising platforms deliver the same return on ad spend (ROAS). Understanding these differences is essential for allocating your budget effectively. Analyzing platform performance is key to maximizing returns. Let’s explore how various channels perform and what factors influence their effectiveness.
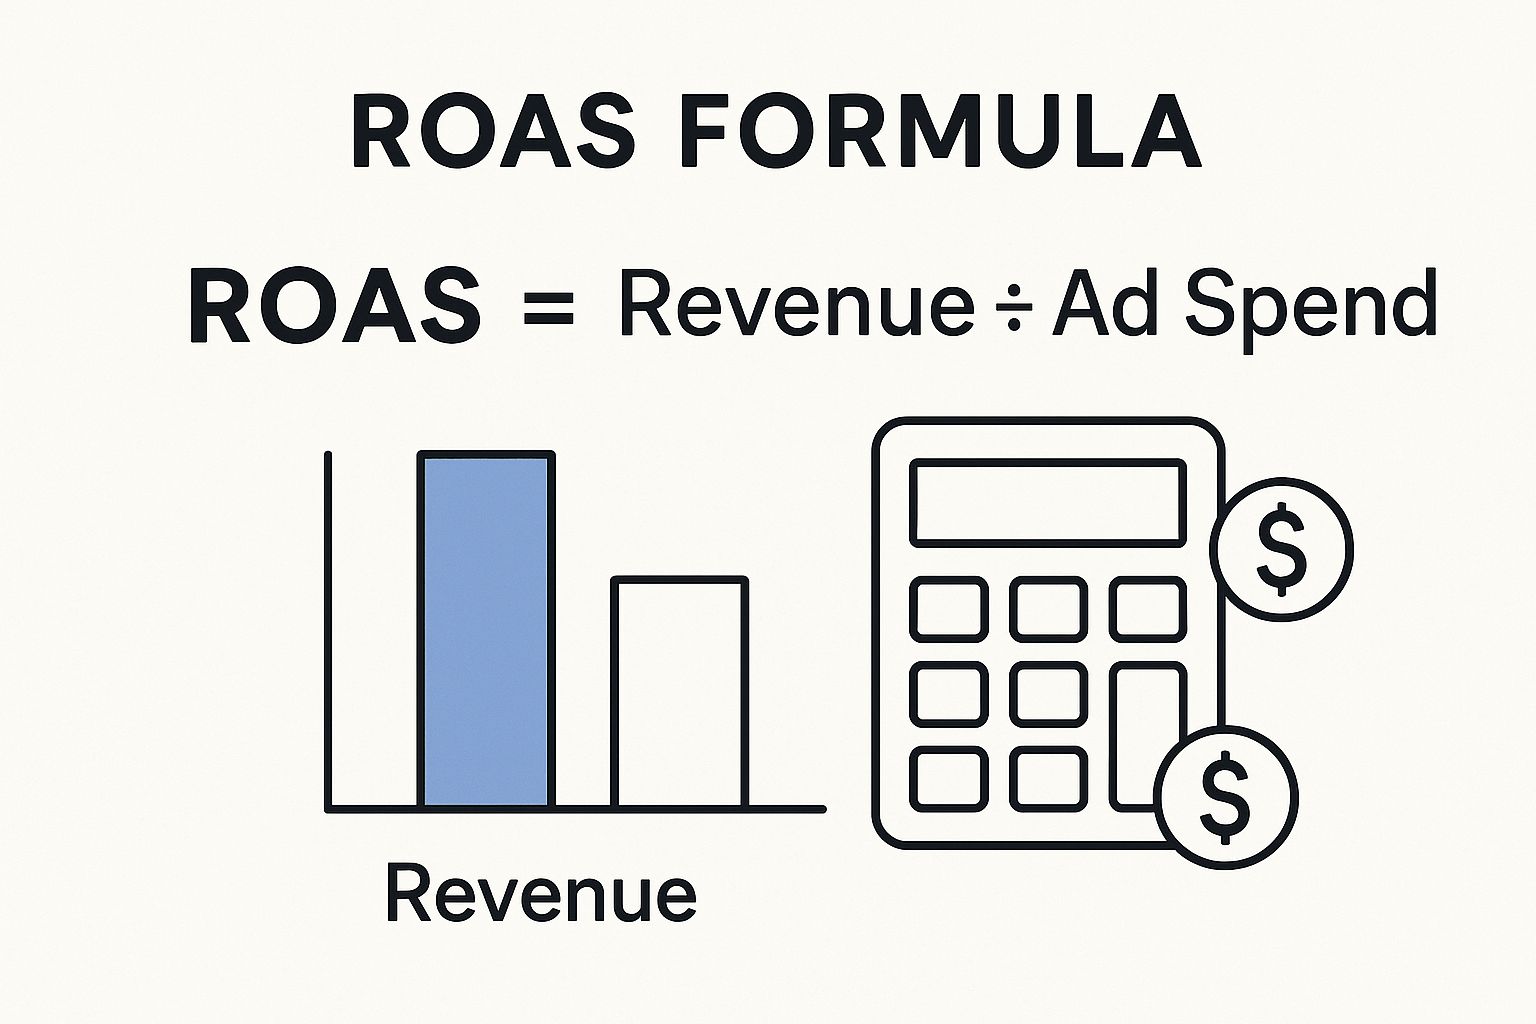
The infographic above illustrates the ROAS formula: Revenue / Ad Spend. This simple calculation, applied to real-world data, reveals significant performance differences across platforms. This emphasizes the importance of platform-specific ROAS analysis.
For example, consider the performance variations between platforms like Google Ads, formerly Twitter (now X), and Facebook. While Google suggests advertisers typically see an 8x return on their investment, platform-specific data tells a different story. For more detailed statistics, see: World Advertising Industry Spend, Revenue & Statistics. X reported the highest average ROAS in 2023 at 6.8, meaning for every dollar spent, advertisers earned $6.80. This considerably outperforms Facebook’s average return, highlighting the need for a strategic approach to platform selection.
Understanding Platform Strengths and Weaknesses
Each platform has its own advantages and disadvantages. Search engines excel at capturing immediate purchase intent. Social media platforms, however, are more effective for building brand awareness and engaging target audiences. Choosing the right platform is crucial for optimizing ROAS.
Display advertising can be useful for retargeting and reaching wider audiences. However, display ads typically have lower click-through rates than search and social media ads. Tailoring your strategies and creative assets to each platform is essential.
To help illustrate the varying ROAS across different platforms, let’s examine some benchmark data:
The following table provides a comparison of average ROAS performance across major advertising platforms, including best use cases and typical ROAS ranges.
Platform ROAS Comparison: Average Returns by Channel
| Platform | Average ROAS | Best Use Case | Typical Range |
|---|---|---|---|
| Google Ads | 2x | Lead Generation, E-commerce | 2x – 4x |
| X (formerly Twitter) | 6.8x | Brand Awareness, Engagement | 4x – 10x |
| 4x | Brand Building, Retargeting | 2x – 6x | |
| 2x | B2B Lead Generation, Recruitment | 1x – 3x | |
| Display Ads | 1.5x | Retargeting, Brand Awareness | 1x – 2x |
As you can see, the average ROAS varies significantly across different platforms. X demonstrates exceptionally high returns, while other platforms offer more modest returns. This data emphasizes the importance of understanding your campaign goals and selecting the most appropriate channels for achieving those goals.
Seasonal Variations and Campaign Objectives
Seasonal trends also impact platform performance. Some platforms see higher engagement during particular holidays or shopping seasons. Your campaign objectives also influence which platform will deliver the best results. Brand awareness campaigns might perform better on social media, while lead generation campaigns could be more effective on search engines.
By understanding each platform’s strengths, seasonal trends, and aligning your campaign objectives accordingly, you can optimize ad spend and maximize ROAS. This ensures you’re investing your advertising budget where it generates the strongest returns for your specific business and audience.
Why ROAS Measurement Matters More Than Ever
The advertising landscape has undergone a significant transformation, making precise return on ad spend (ROAS) calculations essential for maintaining a competitive edge. While digital advertising presents vast opportunities, it also introduces complex measurement challenges. Businesses that grasp and monitor ROAS consistently outperform those relying on estimations or less informative metrics. Understanding how to calculate and leverage ROAS is now more critical than ever.
The global advertising market is experiencing rapid expansion. In 2024, spending reached approximately $917 billion, an 8.5% year-over-year increase. Forecasts predict this number will exceed $1.17 trillion by 2028. As of 2024, digital channels command 70% of global ad spend, underscoring the growing preference for trackable ROAS. For a deeper dive into these statistics, explore this resource: Global Advertising Spending Statistics.
The Rise of Performance Measurement
Several factors contribute to the growing emphasis on performance measurement. Dominant platforms like Google and Facebook prioritize data-driven advertising, encouraging businesses to concentrate on metrics such as ROAS. Evolving consumer behavior, with interactions occurring across multiple touchpoints, necessitates a more sophisticated measurement approach.
Furthermore, changes in privacy regulations and attribution complexities are reshaping ROAS calculations. Marketers must adapt and embrace new strategies to maintain accuracy, including focusing on multi-touch attribution models and understanding conversion windows. For further insights on maximizing returns, consider this article: How to master your content marketing ROI.
Adapting to the Shifts
Despite the inherent complexities, businesses must adapt to these industry changes. This involves investing in robust tracking tools and exploring advanced analytics. By mastering these challenges, companies can unlock the full potential of digital advertising and secure a significant competitive advantage. Ultimately, understanding and optimizing ROAS is no longer optional, but a fundamental requirement for success in today’s advertising environment.
Navigating Modern Attribution and Mobile Measurement Challenges
Calculating return on ad spend (ROAS) isn’t as simple as it once was. With the rise of mobile, accurately measuring advertising effectiveness requires a deeper understanding of how users interact with ads across different devices and platforms. This necessitates a more nuanced approach to attribution, the process of assigning credit for conversions to various touchpoints in the customer journey.
Multi-Device and Cross-Platform Tracking
Today’s consumer journey often spans multiple devices. Someone might see an ad on their phone, research the product on their laptop, and finally purchase on their tablet. This multi-device behavior makes tracking and attribution complex. Further complicating matters is cross-platform tracking, the need to connect user actions across advertising platforms like Google, Facebook, and X (formerly Twitter).
For instance, imagine a customer sees a mobile ad, later researches on their desktop, and ultimately buys on their tablet. Connecting these touchpoints accurately requires robust tracking solutions.
Handling View-Through and Assisted Conversions
ROAS measurement should consider more than just the last click. View-through conversions, where a user sees an ad without clicking but later converts, and assisted conversions, where a touchpoint like an email or social media post contributes to the conversion path, often go unnoticed. Yet, these indirect influences can significantly impact overall ROAS.
Measuring ROAS isn’t just about calculations; it’s about understanding the bigger picture of advertising impact. Mobile advertising represents a substantial portion of digital ad spend, projected to reach nearly $400 billion globally in 2024, a significant jump of over 21% from 2022. You can explore more statistics at PPC Statistics. This growth highlights the importance of precise ROAS calculations, particularly in the mobile space.
Addressing Attribution Gaps and Maintaining Accuracy
Even with advanced technology, attribution gaps persist. Privacy changes, like the phasing out of third-party cookies, restrict tracking capabilities. This makes achieving perfect attribution a challenge. However, marketers can utilize strategies like incrementality testing to isolate the effects of specific marketing efforts on incremental conversions and improve measurement accuracy.
Incrementality Testing and Media Mix Modeling
Media mix modeling is another powerful tool. This statistical analysis evaluates the effectiveness of various marketing channels in driving overall business results. Combining these techniques with precise campaign tracking and effective cross-platform strategies allows for more accurate ROAS calculations. This comprehensive approach provides marketers with the necessary information to navigate the complexities of today’s advertising ecosystem.
Proven Strategies for Optimizing Your ROAS Performance
Calculating your return on ad spend (ROAS) is the first step. The real value lies in using this data to improve your advertising campaigns. This involves consistently refining your strategies for better results. This section explores proven optimization techniques used by successful marketers.
Refining Your Audience Targeting
One of the most effective ways to improve ROAS is through refined audience targeting. This means identifying the specific demographics, interests, and behaviors of your ideal customers. For example, if you sell high-end running shoes, targeting athletes interested in marathons would likely yield a higher ROAS than targeting a general audience. This focused approach ensures your ads are seen by the most receptive potential customers.
This precise targeting minimizes wasted ad spend and maximizes your chances of reaching engaged users.
Leveraging A/B Testing
A/B testing is a crucial strategy for optimizing both ad creatives and landing pages. It involves creating two versions of an ad with slight variations, then presenting each version to a different audience segment. Analyzing the performance of each version identifies which elements resonate best and drive higher conversions. You might be interested in: How to master your content marketing ROI. This data-driven approach allows for continuous improvement of your campaigns.
By constantly testing and refining, you can identify what truly works for your audience.
Implementing Smart Bidding Strategies
Smart bidding strategies, offered by platforms like Google Ads, can significantly impact ROAS. These strategies use machine learning to automate bidding based on factors like conversion history, device, location, and time of day. This automation often leads to more efficient ad spend and increased conversions. Marketers are then free to focus on other crucial optimization efforts.
This automation takes the guesswork out of bidding, allowing for more efficient use of your budget.
Optimizing for Different Performance Levels
Different optimization tactics will be more effective depending on your current ROAS. If your ROAS is low, focus on improving quality score and conversion rates. For a higher ROAS, consider expanding reach and testing new audiences. This tailored approach maximizes improvement potential at each stage of your campaign.
By aligning your strategies with your current performance, you can ensure continuous growth.
The following table provides a structured overview of optimization strategies based on ROAS performance. It outlines key actions, their expected impact, and the typical timeline for observing results.
ROAS Optimization Checklist: Key Actions by Performance Level
| Current ROAS Range | Priority Actions | Expected Impact | Timeline |
|---|---|---|---|
| < 2:1 | Improve quality score, optimize landing pages | Increased conversion rates | Short-term |
| 2:1 – 4:1 | Refine audience targeting, A/B test ad creative | Higher ROAS, improved click-through rates | Medium-term |
| > 4:1 | Expand reach to new audiences, test new ad formats | Increased scale, sustained ROAS growth | Long-term |
This table provides a practical guide for adjusting your optimization efforts based on your current ROAS. By implementing these strategies and consistently monitoring results, you can steadily increase your ROAS while maintaining sustainable growth. This data-driven approach empowers you to make informed decisions and maximize the return on your advertising investment.
Key Takeaways: Your ROAS Mastery Action Plan
This actionable plan combines the essential elements of return on ad spend (ROAS) calculation and optimization. It’s designed to help you quickly implement strategies that improve advertising performance and drive business growth. We’ll cover the key metrics to track, potential warning signs, and clear indicators of success for your ROAS.
Accurate ROAS Calculation Checklist
Calculating ROAS accurately is the first step toward optimization. This checklist helps ensure your calculations are precise and provide valuable insights:
- Include all costs: Factor in all advertising expenses. This includes direct ad spend, creative development, agency fees, and platform costs.
- Account for delayed conversions: Conversions don’t always happen immediately. Use appropriate conversion windows to attribute revenue to the correct campaigns.
- Utilize multi-touch attribution: Implement a multi-touch attribution model to distribute credit fairly across all touchpoints in the customer journey.
Benchmarking Your ROAS: Industry Insights
Comparing your ROAS to industry benchmarks offers valuable context. While a 4:1 ROAS is often considered a good starting point, the ideal number varies significantly depending on your industry, business model, and the specifics of your campaigns. Researching industry averages helps you set realistic goals and pinpoint areas for potential improvement.
Ongoing Optimization: A Systematic Approach
ROAS optimization is an ongoing process. Here’s a systematic approach to ensure consistent improvement:
- Regularly monitor ROAS: Track ROAS across different campaigns, platforms, and audience segments. This detailed view helps identify strengths and weaknesses.
- A/B test everything: Test ad creatives, landing pages, and targeting parameters to identify the most effective elements. A/B testing provides data-driven insights.
- Refine audience targeting: Continuously refine your audience targeting to reach the most receptive customers and minimize wasted ad spend.
- Leverage smart bidding: Explore automated bidding strategies available on platforms like Google Ads to optimize your bids for conversions and improve ROAS.
Identifying Warning Signs and Success Indicators
Tracking key metrics alongside ROAS provides a comprehensive view of your advertising performance. A declining ROAS, coupled with decreasing conversion rates, signals a need for immediate adjustments. Conversely, a rising ROAS, along with increasing conversion rates and average order value, indicates that your strategies are effective.
By focusing on these practical takeaways and consistently refining your approach, you can master ROAS calculation and optimization, maximizing your advertising impact and achieving sustainable growth.
Ready to elevate your marketing performance? ReachLabs.ai offers expert guidance and data-driven strategies to optimize your ROAS and achieve your business goals. Visit ReachLabs.ai to learn more and transform your advertising results.


