
In a data-driven world, guesswork is the fastest way to an empty budget. Simply tracking website traffic or social media likes isn’t enough to prove marketing’s impact on the bottom line. You need to focus on metrics that connect marketing activities directly to business outcomes like revenue, customer loyalty, and sustainable growth.
This guide moves beyond surface-level numbers to provide detailed marketing performance metrics examples that leading brands use to make strategic decisions. We’ll break down the what, why, and how for 8 essential metrics, complete with formulas, real-world examples, and actionable takeaways you can implement today to prove, and improve, your marketing ROI.
We will explore everything from the cost of acquiring a customer (CAC) to their long-term value (CLV), covering crucial indicators like Return on Marketing Investment (ROMI), lead quality (MQLs), and conversion rates. This list is designed to equip you with the knowledge to build a robust performance measurement framework, shifting your focus from vanity metrics to true business value. Each example is a deep dive into how to track, analyze, and optimize for real results, helping you justify your marketing spend and drive predictable growth.
1. Customer Acquisition Cost (CAC)
Customer Acquisition Cost (CAC) is a critical marketing performance metric that calculates the total expense required to acquire a single new customer. It encompasses all sales and marketing costs, including salaries, ad spend, tools, and overhead, over a specific period, divided by the number of new customers gained in that same timeframe. A low CAC indicates an efficient and scalable marketing and sales operation.
Formula: CAC = (Total Sales & Marketing Costs) / (Number of New Customers Acquired)
Monitoring CAC is essential for evaluating campaign profitability, optimizing your marketing mix, and ensuring long-term business sustainability. A healthy business model typically requires a Customer Lifetime Value (LTV) that is at least three times its CAC.
CAC in Action: Dollar Shave Club’s Viral Launch
Dollar Shave Club famously disrupted the men’s grooming industry with a viral video strategy that achieved an astonishingly low CAC. Their 2012 launch video, “Our Blades Are F***ing Great,” cost just $4,500 to produce and generated 12,000 sign-ups within 48 hours.
Strategic Analysis:
- Channel Focus: They bypassed expensive traditional advertising (TV, print) and focused on a low-cost, high-impact digital channel: YouTube.
- Content Strategy: The content was humorous, relatable, and directly addressed a common customer pain point (overpriced razors), making it highly shareable.
- Result: This approach yielded a CAC estimated to be under $10, far below the industry average, which can exceed $200 for established CPG brands relying on traditional advertising.
The following bar chart illustrates how CAC can vary significantly across different industries, highlighting the importance of benchmarking within your specific sector.
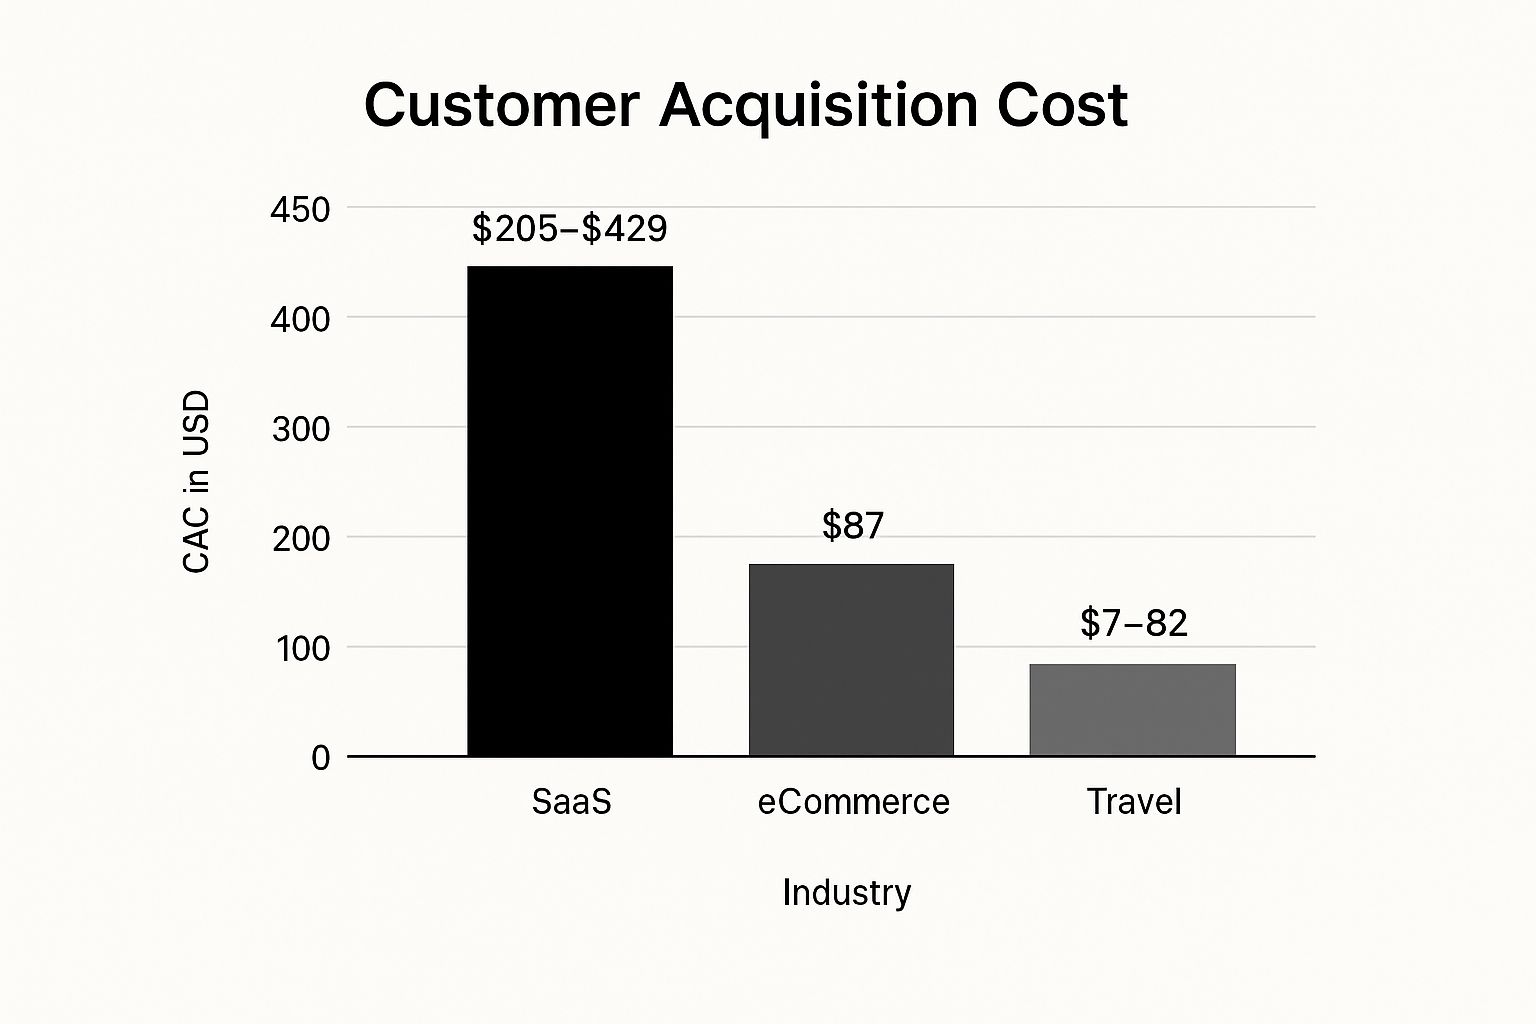
This chart clearly shows that SaaS businesses face the highest acquisition costs, while the travel and eCommerce sectors often operate with much lower CAC, reinforcing the need for industry-specific efficiency strategies.
Actionable Takeaways
To optimize your marketing efforts, it’s crucial to not just track your overall CAC but to analyze it by channel. This allows you to identify your most profitable acquisition sources and reallocate your budget accordingly. Consistently tracking this metric over time provides insights into the effectiveness of your marketing strategies and helps forecast future growth. For those looking to dive deeper, you can explore strategies to reduce Customer Acquisition Cost on ReachLabs.ai.
2. Return on Marketing Investment (ROMI)
Return on Marketing Investment (ROMI) is a vital marketing performance metric that measures the revenue generated by a marketing campaign or effort against its cost. Unlike a broader Return on Investment (ROI), ROMI isolates the impact of marketing spend, providing a clear picture of its direct contribution to the top line. A high ROMI signifies that marketing efforts are efficiently converting dollars spent into revenue.
Formula: ROMI = [(Revenue Attributable to Marketing - Marketing Costs) / Marketing Costs] * 100
Calculating ROMI is crucial for justifying marketing budgets, optimizing channel allocation, and proving the value of marketing initiatives to stakeholders. It helps marketers make data-driven decisions about where to invest for the highest returns.
ROMI in Action: Starbucks’ Mobile Loyalty Program
Starbucks has masterfully used its mobile app and loyalty program to generate an exceptional ROMI. By integrating payments, rewards, and personalized offers into a single platform, the company created a powerful direct marketing channel that drives repeat purchases and increases customer lifetime value, representing a prime example of ROMI-focused marketing.
Strategic Analysis:
- Data-Driven Personalization: The app collects valuable customer data, enabling Starbucks to send targeted offers and personalized recommendations that are more likely to convert, boosting revenue per customer.
- Frictionless Experience: Combining payment and loyalty into one seamless mobile experience encourages frequent use and deepens customer engagement, increasing the return on the initial app development investment.
- Result: This integrated digital ecosystem reportedly generates a 4:1 ROMI, meaning for every dollar spent on the program, Starbucks generates four dollars in revenue, demonstrating the power of a well-executed loyalty strategy.
This approach transformed a simple coffee purchase into a rich data exchange, allowing Starbucks to optimize its marketing spend with surgical precision and drive significant incremental revenue.
Actionable Takeaways
To accurately measure ROMI, it’s essential to implement multi-touch attribution models that assign credit to various touchpoints along the customer journey, not just the last click. Marketers should also conduct incrementality testing to distinguish between sales that would have happened anyway and those directly caused by their campaigns. By regularly tracking ROMI for different channels, you can identify your most effective strategies and reallocate your budget to maximize overall profitability.
3. Marketing Qualified Leads (MQLs)
A Marketing Qualified Lead (MQL) is a prospect who has shown more interest in your brand than other leads but is not yet ready for a sales conversation. This qualification is based on their engagement with marketing efforts, such as downloading an ebook, repeatedly visiting a pricing page, or signing up for a webinar. MQLs are a vital metric for aligning marketing and sales teams by creating a clear handoff point.
Formula: There is no single formula, but MQLs are defined by a lead scoring system. Lead Score = (Demographic Score) + (Behavioral Score). A prospect becomes an MQL once their score crosses a predefined threshold agreed upon by both sales and marketing.
Tracking MQLs helps marketing measure the effectiveness of its campaigns in generating sales-ready interest. It ensures that the sales team spends its time on prospects who have a higher likelihood of converting, improving overall efficiency.
MQLs in Action: HubSpot’s Lead Scoring Optimization
HubSpot, a leader in marketing automation, uses its own platform to refine its MQL process, achieving a 106% increase in MQL-to-customer conversion rates through optimized lead scoring. They moved beyond simple actions to a more predictive model that analyzed which behaviors actually correlated with sales success.
Strategic Analysis:
- Data-Driven Scoring: HubSpot analyzed historical data to identify the specific on-site actions and demographic traits of their highest-value customers. They discovered that certain content downloads were far more predictive of a purchase than others.
- Negative Scoring: They introduced negative scoring for certain actions, such as visits to the careers page or student email addresses, which helped filter out non-sales-ready leads and improve the quality of leads passed to sales.
- Result: This refined system significantly increased the quality of MQLs. By focusing the sales team’s efforts on leads with a proven statistical likelihood to close, HubSpot drastically improved its conversion rate and pipeline efficiency.
Actionable Takeaways
To effectively use MQLs as one of your key marketing performance metrics, you must create a dynamic feedback loop with your sales team. Regularly review your lead scoring criteria to ensure they accurately reflect lead quality and adjust thresholds based on MQL-to-SQL (Sales Qualified Lead) conversion rates. Implementing lead nurturing workflows for prospects who don’t yet meet the MQL threshold ensures you continue to engage them until they are ready for a sales conversation.
4. Conversion Rate
Conversion Rate is a foundational marketing performance metric that measures the percentage of users who complete a desired action. This “conversion” can be anything from making a purchase to signing up for a newsletter or downloading an ebook. It is a direct indicator of how effectively your marketing messaging and user experience are persuading potential customers to act.
Formula: Conversion Rate = (Number of Conversions / Total Visitors) * 100
A high conversion rate signifies that your marketing is compelling and your website is well-designed, leading directly to better ROI. Tracking this metric is vital for optimizing everything from landing pages and ad copy to entire marketing funnels. A strong focus on conversion rate optimization (CRO) ensures you are maximizing the value of the traffic you already have.
Conversion Rate in Action: Netflix’s Artwork A/B Testing
Netflix is a master of data-driven optimization, constantly running A/B tests to improve user engagement and retention. One of their most impactful strategies involves personalizing thumbnail artwork for shows and movies to maximize the click-through (or conversion) rate for viewers starting a new title.
Strategic Analysis:
- Hypothesis-Driven Testing: Netflix hypothesizes that different artwork will appeal to different user segments based on their viewing history. A user who watches action movies might see an explosive poster, while a romance fan sees a poster featuring the lead couple.
- Systematic Optimization: They systematically test multiple versions of artwork for a single title, measuring which one generates the most plays. This turns a creative decision into a scientific process.
- Result: This granular approach to personalization has been shown to increase viewing hours significantly, with some tests improving conversion rates for specific titles by 20-30%. This directly impacts user engagement and long-term retention.
This demonstrates how even seemingly minor visual elements can be powerful levers for conversion, making it a critical focus area among top-tier marketing performance metrics examples.
Actionable Takeaways
To improve your conversion rate, you must adopt a culture of continuous testing. Systematically analyze user behavior on key pages to identify drop-off points and form hypotheses for improvement. Test one element at a time, such as the headline, call-to-action (CTA) button color, or form length, to isolate what drives results. Segmenting your conversion data by traffic source, device, and user demographic will reveal which channels and audiences are your most valuable. For a comprehensive guide, you can learn how to monitor conversion metrics on ReachLabs.ai.
5. Customer Lifetime Value (CLV/LTV)
Customer Lifetime Value (CLV or LTV) is a crucial marketing performance metric that projects the total net profit a business can expect to earn from a single customer throughout their entire relationship. It moves beyond short-term gains, like a single purchase, to provide a long-term perspective on the value of each customer, guiding strategic decisions on acquisition, retention, and marketing spend.
Formula: CLV = (Average Purchase Value) x (Average Purchase Frequency) x (Average Customer Lifespan)
Monitoring CLV is essential for building a sustainable business. It helps companies understand how much they can afford to spend on acquiring new customers and highlights the importance of retention efforts. A healthy business model strives for a CLV to CAC ratio of at least 3:1, indicating strong profitability and growth potential.
CLV in Action: Starbucks’ Loyalty Program
Starbucks has mastered the art of maximizing CLV through its highly effective loyalty program, Starbucks Rewards. By incentivizing repeat business with a system of “Stars” that customers can redeem for free products, the company significantly increases both purchase frequency and customer lifespan, resulting in an average CLV estimated at over $14,000.
Strategic Analysis:
- Personalization: The Starbucks mobile app uses customer data to deliver personalized offers and recommendations, encouraging more frequent visits and higher spending per transaction.
- Frictionless Experience: Features like mobile ordering and payment remove barriers to purchase, making it exceptionally convenient for customers to remain loyal to the brand.
- Result: This focus on retention and customer experience directly boosts all components of the CLV formula. The program not only drives repeat sales but also fosters a deep sense of brand loyalty that extends the average customer lifespan significantly.
Actionable Takeaways
To optimize for CLV, focus on creating exceptional customer experiences that foster loyalty. Segment your customer base to identify your most valuable cohorts and tailor retention strategies specifically for them. By investing in loyalty programs, personalized communication, and superior customer service, you can systematically increase average order value and purchase frequency, turning one-time buyers into lifelong advocates for your brand.
6. Brand Awareness Metrics
Brand Awareness Metrics gauge how familiar a target audience is with a brand and its offerings. These marketing performance metrics are not a single formula but a collection of qualitative and quantitative measures, including share of voice, brand mention tracking, and direct traffic. While not always directly tied to immediate revenue, strong brand awareness is a powerful long-term asset that builds trust, commands pricing power, and drives market share.
Key Indicators: Direct Website Traffic, Social Media Mentions & Share of Voice, Branded Search Volume, and Surveys (Aided vs. Unaided Recall)
Tracking these metrics is vital for understanding a brand’s cultural impact and competitive standing. High awareness often correlates with lower customer acquisition costs over time, as it creates a foundation of familiarity and preference that makes direct response campaigns more effective.
Brand Awareness in Action: Tesla’s Minimal-Ad Dominance
Tesla famously achieved a dominant level of brand awareness with a near-zero traditional advertising budget. Instead of paid media, the company relied on public relations, the personal brand of its CEO Elon Musk, and innovative product design to generate massive organic conversation and media coverage, making it one of the most discussed companies globally.
Strategic Analysis:
- Earned Media Focus: Tesla prioritized product innovation and high-profile announcements that were inherently newsworthy, generating billions of dollars in earned media value.
- CEO as a Brand: Elon Musk’s active and often controversial social media presence created a constant stream of brand mentions, keeping Tesla in the public consciousness.
- Result: This strategy resulted in exceptionally high branded search volume and share of voice that dwarfed competitors who spent hundreds of millions on advertising. Tesla proved that in the digital age, a compelling narrative can be more powerful than a massive ad budget.
Actionable Takeaways
To effectively measure brand awareness, businesses should combine several methods. Use tools like Google Trends to track branded search interest and social listening platforms to monitor share of voice and sentiment. Supplement this data with periodic brand recall surveys targeted at your ideal customer segments. By correlating increases in these awareness metrics with long-term sales trends and market share, you can better quantify the tangible business impact of your brand-building efforts.
7. Email Marketing Metrics
Email Marketing Metrics are a suite of performance indicators used to measure the effectiveness of email campaigns. This includes key data points like open rates, click-through rates (CTR), conversion rates, and unsubscribe rates. These metrics provide a direct line of sight into audience engagement, content relevance, and the overall return on investment (ROI) of an email strategy.
Key Formulas:
- Open Rate:
(Unique Opens / Emails Delivered) * 100 - Click-Through Rate (CTR):
(Total Clicks / Emails Delivered) * 100 - Conversion Rate:
(Number of Conversions / Emails Delivered) * 100
Monitoring these marketing performance metrics examples is crucial for understanding subscriber behavior and optimizing campaigns. A strong email marketing program, as noted by providers like Campaign Monitor, can generate an average ROI of $42 for every $1 spent, making it one of the most cost-effective channels available.
Email Marketing Metrics in Action: TheSkimm’s Subscriber Growth
TheSkimm, a daily news digest, built its media empire almost entirely on the back of a single email newsletter. By relentlessly focusing on email marketing metrics, it grew to over 7 million subscribers while maintaining impressive engagement, including a daily open rate that consistently exceeds 20%, well above the industry average of around 15%.
Strategic Analysis:
- Content Strategy: TheSkimm developed a unique, conversational tone that resonated deeply with its target audience of millennial women, making the email a must-read part of their daily routine.
- Engagement Focus: Instead of just tracking opens, they prioritized creating content so valuable that opening the email became a daily habit. This focus on utility and voice built fierce loyalty.
- Result: High open rates and strong word-of-mouth referrals became their primary growth engine, demonstrating how optimizing for engagement metrics can directly fuel acquisition.
This focused approach showcases how a deep understanding of email metrics can transform a simple newsletter into a powerful, revenue-generating media business.
Actionable Takeaways
To maximize your email performance, segment your audience based on their behavior, preferences, and purchase history to deliver highly personalized content. Regularly A/B test elements like subject lines and calls-to-action to incrementally improve open and click-through rates. Finally, maintain excellent list hygiene by removing inactive subscribers to improve deliverability and ensure your messages reach your most engaged audience.
8. Social Media Engagement Rate
Social Media Engagement Rate measures the level of interaction that content receives from an audience on a social media platform. This key metric, among other marketing performance metrics examples, calculates interactions like likes, comments, shares, and saves relative to follower count or reach, signaling how effectively content resonates with your audience. A high engagement rate indicates strong brand loyalty, compelling content, and favorable positioning within platform algorithms.
Formula: Engagement Rate = (Total Engagements / Total Followers or Reach) * 100
Monitoring this metric is crucial for understanding content performance, refining your social strategy, and building a community around your brand. It moves beyond vanity metrics like follower count to measure the actual connection you have with your audience.

Engagement in Action: Wendy’s Viral Twitter Presence
Wendy’s transformed its brand perception by adopting a witty, humorous, and sometimes savage tone on Twitter, a stark contrast to the typically bland corporate voice. This strategy led to viral moments, such as the #NuggsForCarter campaign, which became the most retweeted tweet of all time.
Strategic Analysis:
- Voice and Tone: They developed a unique and authentic brand personality that was perfectly suited for the platform’s conversational nature, encouraging user interaction.
- Community Interaction: The social media team actively engaged in real-time conversations, responding to customers, roasting competitors, and participating in trending topics.
- Result: This approach dramatically increased their follower count by millions and generated massive earned media, turning their Twitter account into a powerful brand asset with consistently high engagement rates.
This example proves that a well-defined content strategy tailored to the platform’s culture can generate engagement far more effectively than a generic, cross-posted approach.
Actionable Takeaways
To boost your engagement, focus on creating content that provides value, sparks conversation, or entertains your specific audience. Analyze your social media analytics to identify which content formats (e.g., videos, carousels, polls) perform best and at what times your audience is most active. Consistently interacting with your community by responding to comments and messages is also essential for building a loyal following. For those looking to dive deeper, you can discover techniques to improve Social Media Engagement Rate on ReachLabs.ai.
Top 8 Marketing Metrics Comparison
| Metric | Implementation Complexity 🔄 | Resource Requirements ⚡ | Expected Outcomes 📊 | Ideal Use Cases 💡 | Key Advantages ⭐ |
|---|---|---|---|---|---|
| Customer Acquisition Cost (CAC) | Medium – requires integrated tracking systems | Moderate – marketing, sales expenses tracking | Clear ROI, cost efficiency insights | Budget allocation, pricing strategy optimization | Provides clear ROI visibility; enables channel comparison |
| Return on Marketing Investment (ROMI) | High – complex attribution modeling | High – sophisticated analytics and tracking | Revenue tied directly to marketing spend | Campaign/channel performance evaluation, budget justification | Direct link to business outcomes; drives marketing accountability |
| Marketing Qualified Leads (MQLs) | High – lead scoring models and cross-team alignment | High – marketing automation platforms | Higher sales efficiency, pipeline quality | Sales & marketing alignment, lead nurturing | Focuses sales on qualified prospects; improves pipeline predictability |
| Conversion Rate | Low – basic % calculation at various funnel points | Low – web analytics tools | Immediate optimization feedback | Funnel optimization, campaign effectiveness | Easy to understand; enables A/B testing and bottleneck ID |
| Customer Lifetime Value (CLV) | High – complex data integration & predictive modeling | High – requires multiple data sources | Long-term profitability insights | Strategic budgeting, retention programs | Guides acquisition spend; identifies valuable customer segments |
| Brand Awareness Metrics | Medium – requires surveys, social listening | Moderate to High – research studies, tools | Long-term brand positioning insights | Brand marketing justification, competitive benchmarking | Leading indicator of marketing success; supports premium pricing |
| Email Marketing Metrics | Low to Medium – real-time tracking via platforms | Moderate – email platforms, content creation | Strong campaign performance and engagement | Email campaign optimization, retention communication | High ROI channel; enables precise segmentation |
| Social Media Engagement Rate | Medium – requires analytics and content strategy | Moderate – ongoing content creation and management | Real-time content quality and audience connection | Brand building, community engagement | Indicates authentic engagement; improves organic reach |
Activating Your Data: Turning Metrics into Momentum
Throughout this guide, we’ve explored a powerful set of marketing performance metrics examples, moving from initial acquisition costs to long-term customer value. We’ve dissected formulas, analyzed real-world applications, and uncovered the strategic insights that separate high-growth companies from the rest. The journey from tracking a simple Conversion Rate to calculating Customer Lifetime Value (CLV) is the a path toward marketing maturity and predictability.
The core lesson is this: metrics are not just numbers on a dashboard; they are the language of your customer. They tell you what’s working, what’s failing, and where your greatest opportunities for growth lie.
From Measurement to Actionable Strategy
The true power of these metrics is unlocked when you move beyond passive reporting and into active optimization. Viewing your Customer Acquisition Cost (CAC) and CLV in tandem, for instance, transforms your spending from a speculative expense into a calculated investment. A high MQL count with a low conversion rate isn’t a failure, it’s a clear signal to refine your sales handoff process or re-evaluate your lead qualification criteria.
Your next steps should be to build a system, not just a spreadsheet.
- Create a Centralized Dashboard: Integrate your most critical KPIs into one view. This allows you to see the interconnectedness of your efforts, such as how social media engagement impacts brand awareness and, ultimately, lead generation.
- Establish a Rhythm of Review: Set aside dedicated time weekly or bi-weekly for your team to review these metrics. The goal isn’t to judge past performance but to ask strategic questions: “What does this data suggest we do next?”
- Foster a Culture of Experimentation: Use your baseline metrics as a control for A/B testing. Test new ad copy, landing page designs, or email subject lines and measure the impact with precision. Let the data, not assumptions, guide your creative direction.
The Ultimate Goal: A Predictable Revenue Engine
Mastering these marketing performance metrics examples empowers you to build a marketing function that is no longer a cost center, but a predictable and scalable revenue engine. It gives you the confidence to advocate for bigger budgets, the clarity to allocate resources effectively, and the agility to pivot your strategy based on real-time feedback from the market.
By embracing a data-first mindset, you shift from simply doing marketing to strategically engineering growth. Each metric is a lever you can pull, and understanding how they work together gives you control over your business’s trajectory. This is how you build a resilient, adaptable, and highly profitable marketing machine.
Ready to transform your data into a decisive competitive advantage? The ReachLabs.ai platform automates the tracking of these critical metrics and provides AI-powered insights to help you make smarter, faster decisions. Stop guessing and start growing by visiting ReachLabs.ai to see how our tools can build your marketing revenue engine.


