
It’s easy to get caught up in the excitement of a high click-through rate. But let’s be honest—clicks don’t pay the bills. The real goal is turning that initial interest into a solid, qualified lead for your sales team. This is where the magic happens, and it starts with a smart connection between your Pay-Per-Click (PPC) campaigns and your website analytics.
Shifting your focus from just getting clicks to generating actual leads requires a different mindset. It means digging deeper than surface-level metrics and understanding the entire user journey. This is precisely why connecting your PPC efforts to a powerful tool like Google Analytics isn’t just a good idea; it’s essential for anyone serious about growth.
The Power of Connecting PPC with Analytics
For years, PPC advertising has been a go-to for marketers. With platforms like Google Ads and Meta Ads, we have access to a firehose of performance data, from impression share all the way down to cost per lead. If you want to see just how much PPC has shaped modern marketing, you can dig into some compelling PPC statistics and their impact.
Looking at your PPC performance and website data separately is like trying to solve a puzzle with half the pieces missing. You see the ad click, but then the user vanishes into a black box. What did they do next? Did they find what they were looking for? Did they become a lead?
When you link these two worlds, you create a single, unified view of the customer’s path. This integration allows you to:
- See what’s actually working: Finally, you can pinpoint the exact campaigns, ad groups, and keywords that are driving valuable leads, not just cheap clicks.
- Plug the leaks: Discover where you’re losing potential customers. Is it a confusing landing page? A broken form? Now you can see the drop-off points and fix them.
- Find hidden gold: Uncover new audience segments or user behaviors that show a high intent to convert, giving you fresh ideas for targeting.
The bottom line is this: by analyzing the full user path, you stop wasting money on traffic that goes nowhere and start doubling down on what actually fuels your sales pipeline. Your goal fundamentally shifts from just buying clicks to acquiring real customers.
This data-driven approach is critical because performance varies wildly between platforms. An ad that works wonders on Google might fall flat on LinkedIn. Understanding these differences is key to optimizing your budget.
Here’s a quick look at why a platform-specific strategy is so important.
PPC Platform Performance at a Glance
| Platform | Average Conversion Rate |
|---|---|
| Google Search Ads | 4.40% |
| Microsoft Advertising | 2.94% |
| Google Display Ads | 0.57% |
| Meta Ads (Facebook) | 9.21% |
Source: WordStream
As you can see, the average conversion rates are all over the map. This table underscores the need to analyze each platform’s performance individually within your own analytics to make informed decisions about where to allocate your ad spend for the best results.
Build Your Data Foundation in Google Analytics
You can’t optimize what you can’t measure. Before we even think about turning more clicks into actual leads, we have to get our data house in order. That means creating a single source of truth by properly linking your Google Ads account with Google Analytics. This connection is the absolute bedrock of a smart PPC strategy.
First things first: turn on auto-tagging in your Google Ads settings. It’s a simple checkbox, but it’s a game-changer. It automatically tacks a unique identifier (the GCLID) onto your ad URLs. Without it, Analytics is flying blind; it can’t correctly trace website sessions and conversions back to the specific campaigns, ad groups, or keywords that brought them there. You’ll be left guessing where your wins are coming from.
This process creates a powerful feedback loop, letting you continuously refine your campaigns based on real-world user behavior.
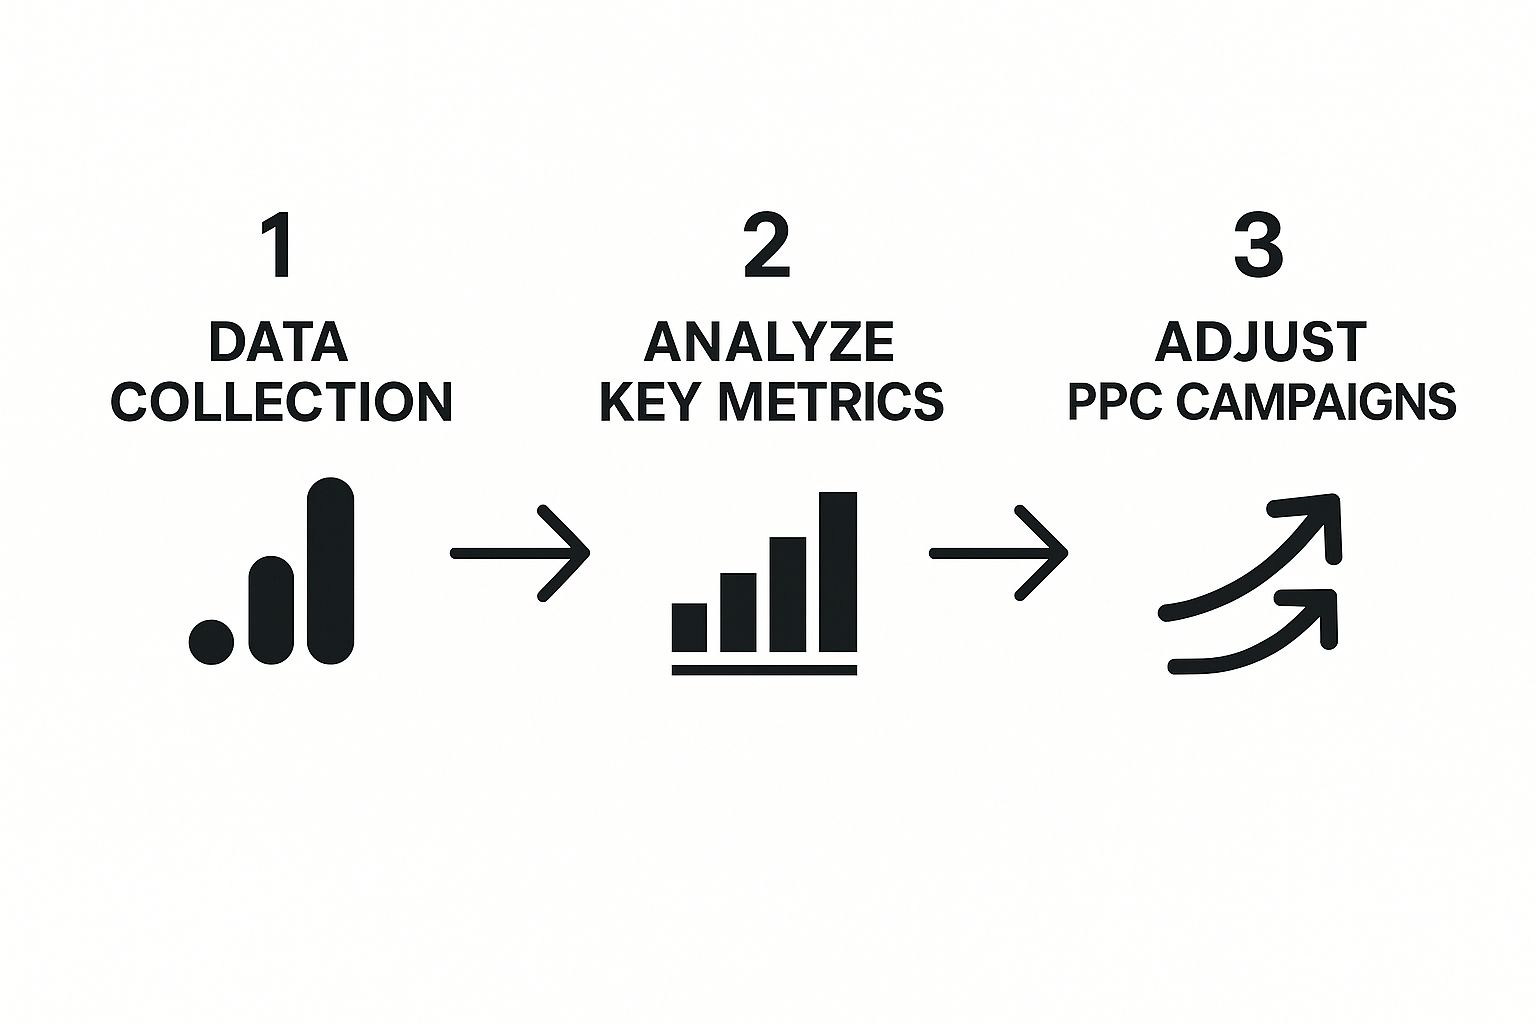
The cycle is pretty straightforward: you gather the data, pull out actionable insights, and use those findings to tweak your PPC campaigns for better and better results.
Define and Import Meaningful Goals
With the accounts linked, it’s time to tell Google what a “lead” actually means for your business. You’ll need to define conversion goals in Google Analytics and then, crucially, import them into Google Ads.
This is how you train Google’s algorithm to understand what success looks like for you. These goals aren’t just vanity metrics; they’re real business actions.
- Form Submissions: This is a classic. Think demo requests, “contact us” forms, or newsletter sign-ups.
- Key Page Views: Sometimes, just reaching a specific page is the goal, like a
/thank-youor/confirmationpage after a purchase or sign-up. - Event-based goals: This gets more granular. You can track things like clicks on a “call now” button, video plays, or a whitepaper download.
Getting comfortable with the Admin section of Google Analytics is key to building this data pipeline. By syncing these goals, you’re making sure both platforms are reading from the same sheet music. This allows Google’s smart bidding strategies to optimize for what really matters—actual business value, not just empty clicks.
To dive deeper into interpreting this data, you can learn more about how to make informed decisions to grow their business and put these metrics to work.
Getting this data foundation right is non-negotiable. It’s the only way to correctly attribute conversions and truly understand what your PPC spend is achieving.
Find Out What Your Users Really Do After the Click
Okay, the technical setup is done. Now for the fun part—turning all that raw data into a real-world strategy that actually converts more clicks into qualified leads. This is where your PPC efforts connect directly with tools like Google Analytics, showing you exactly what happens after someone clicks your ad. No more guessing games.
Your first stop should be the Landing Pages report inside Google Analytics. I can’t overstate how valuable this report is. It’s a goldmine for seeing which pages are greeting your PPC visitors and, crucially, which ones are convincing them to become a lead.
Here’s a classic scenario: You might find that your highest-spending campaign is funneling traffic to a landing page with an abysmal bounce rate. That’s a huge red flag. It tells you there’s a serious mismatch between what your ad promises and what the page delivers.
Watch Their Every Move
To get a more complete picture, you need to visualize the entire customer journey. The Behavior Flow report is perfect for this. It maps out the exact paths people take from the moment they land on your site. You can literally trace their steps from page to page and pinpoint the precise spot where they drop off.
This visual approach is incredibly insightful. Imagine seeing that users from a specific ad group land on a product page, click over to your pricing, and then… they’re gone. Almost all of them. This isn’t a traffic quality problem; the issue is likely your pricing itself or how you’re presenting it.
Finding these friction points is the entire goal. When you see a high-spend campaign leading to a mass exodus on your pricing page, you have a concrete problem to solve. You can then test solutions like clarifying the offer, simplifying the page layout, or adding trust-building elements like testimonials.
This kind of granular analysis is so important because conversion rates are all over the map depending on your industry. For example, some automotive repair businesses see average conversion rates around 14.67%, while a finance or insurance company might be closer to 2.55%.
By digging into your own user behavior, you can optimize for what works in your specific niche. If you’re curious about where you stand, it’s worth checking out these Google Ads benchmarks across industries. This focused analysis helps you stop wasting money and start making changes that get results.
Find Your Best Customers by Digging into Audience and Attribution Data
Connecting Google Ads and Google Analytics is about more than just counting conversions. It’s about discovering exactly who is converting. This is where you move past basic performance reports and start turning clicks into truly qualified leads. You get a direct line to rich demographic and audience data that shines a light on your most valuable customer segments.

Let’s say you dig into your Analytics data and find a bombshell: users aged 35-44 in a handful of specific cities have a conversion rate 3x higher than anyone else. That insight is pure gold.
You can take that information straight back to Google Ads and make targeted bid adjustments. By increasing your bids for that specific demographic and location, you’re putting your money exactly where it has the highest chance of bringing in a new lead. It’s a simple, powerful way to focus your ad spend.
See the Entire Customer Journey, Not Just the Last Step
Understanding how your campaigns work together is just as critical. Too many marketers are still stuck on last-click attribution, a model that mistakenly gives 100% of the credit to the very last thing a user did before converting. This thinking is dangerously outdated because it completely ignores all the earlier touchpoints that got the user there.
Think about it: a customer might see one of your display ads while browsing a news site (first touch). A week later, they search for a general solution you offer and click a non-branded search ad (second touch). Finally, they search for your brand by name and click to convert (final touch). A last-click model would tell you to kill the first two ads, even though they were essential to the final conversion.
This is where you need to get familiar with the Model Comparison Tool in Google Analytics. It lets you see how different attribution models—like Linear, Time Decay, or Position-Based—stack up against the flawed last-click model.
By comparing these models, you can:
- Spot those crucial top-of-funnel campaigns that introduce new people to your brand.
- Give credit to the mid-funnel content that keeps potential customers engaged.
- Stop yourself from pausing ads that are quietly building your pipeline for future growth.
Using this tool gives you a much more honest picture of your marketing efforts. It ensures you’re funding campaigns based on their total contribution to generating leads, not just the final click that sealed the deal.
Turn Your Data Into High-Performing Campaigns

Alright, you’ve done the hard work of digging through your analytics. Now comes the fun part: putting those insights into action. This is where we move from just looking at charts and numbers to actually using that data to turn more of your clicks into real, qualified leads. The whole point is to translate what you’ve learned into campaigns that speak directly to specific groups of people.
One of the most effective ways to do this is by building hyper-targeted remarketing audiences right inside Google Analytics. Forget about showing the same generic ad to every single person who’s ever visited your site. It’s time to get specific.
For instance, maybe your data revealed a segment of users who watched 75% of your demo video but bailed before signing up for a trial. That’s a classic high-intent audience. You can create a custom audience of just those users and hit them with a specific ad on the Google Display Network, maybe offering a one-on-one demo or an extended free trial.
Optimize Landing Pages with A/B Testing
Your analytics data also gives you a fantastic starting point for A/B testing your landing pages. Let’s say you noticed a key page has a sky-high bounce rate. Instead of guessing why, you can now make an educated guess. Is the headline weak? Is the contact form asking for too much information?
Based on that hypothesis, you can spin up a new version of the page and run it against the original.
- Version A (The Control): Your current landing page with that frustratingly high bounce rate.
- Version B (The Challenger): The same page, but this time with a simplified form and a punchier call-to-action like “Get Your Free Quote Now.”
By sending half your traffic to each version, you’ll get concrete proof of what works. This is where your data-driven approach pays off, transforming user behavior insights into measurable gains in your lead generation.
Setting up these tests correctly is the key to figuring out https://www.reachlabs.ai/how-to-measure-marketing-campaign-success/ and building on what works. This continuous cycle of analyzing, acting, and measuring is what separates the PPC pros from the advertisers who are just burning through their budget.
Got Questions About PPC and Google Analytics? We’ve Got Answers.
Even the most seasoned pros have questions when they’re trying to weave their PPC campaigns into Google Analytics. It’s totally normal. Let’s walk through some of the common sticking points I see all the time, so you can keep your lead generation engine humming.
How Long Until I See Real Results?
This is probably the number one question I get. Once you link the accounts and flip on auto-tagging, you’ll start seeing the raw data trickle into Analytics within about 24-48 hours.
But hold on. Seeing data isn’t the same as having meaningful data. You need to resist the urge to make big changes right away. For any decision to be truly data-backed, you need a decent sample size. I usually advise waiting until you have at least a few hundred clicks on a campaign, which might take a couple of weeks depending on your daily spend.
Which Metrics Actually Drive Leads?
It’s easy to get lost in a sea of metrics. Things like Click-Through Rate (CTR) are great for judging ad copy, but for lead generation, they’re just vanity metrics.
If you want to know what’s really working, you need to laser-focus on two things: your Conversion Rate for specific goals (like a demo request or a contact form fill) and your Cost Per Acquisition (CPA). The CPA is the bottom line—it tells you exactly what you’re paying for a qualified lead, which is the key to proving ROI.
A high bounce rate from your PPC traffic is a massive red flag. It almost always means one thing: the promise you made in your ad isn’t being delivered on your landing page. Fix this disconnect before you touch anything else.
If you’re staring at a painfully high bounce rate, here’s your immediate to-do list:
- Check Ad-to-Page Harmony: Seriously, read your ad, then look at your landing page. Is the headline the same? Is the offer front and center?
- Fix Your Page Speed: People have zero patience for slow-loading pages. Use a tool like Google’s PageSpeed Insights to see where you stand.
- Audit Your Search Terms: Jump into the ‘Search Terms’ report in Google Ads. You’re likely paying for clicks from irrelevant searches. Add those terms to your negative keyword list immediately.
These questions become even more critical in a B2B context, where the sales cycle is longer and every lead counts. You can dive deeper into this with more advanced strategies for B2B lead generation to really sharpen your tactics.


